








Weekly COT USD Bulls Shed $10 Billion
A summary of the weekly Commitment of Traders Report (COT) from CFTC to show market positioning among large speculators.
Share this:

Read our guide on how to interpret the weekly COT report
As of Tuesday 7th January:
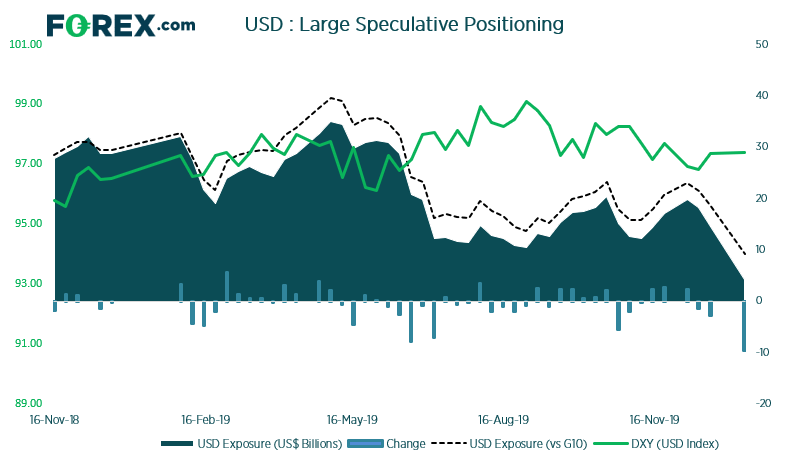
- Net-long exposure to USD fell to $4.3 billion. At -$10.2 billion from the prior week, it’s the least bullish investors have been to the dollar since June 2018.
- Traders were the most bullish on GBP since May 2018.
- Large speculators were on the cusp of flipping net-long on NZD.
- Traders were their least bearish on JPY in nearly 3-months.
USD: With traders shedding -$10.2 billion in net-long exposure, it’s the largest weekly change since June 2018 and the largest negative decline since June 2015. It’s also the least bullish traders have been on the dollar in 19-months, since traders flipped to net-long. (Not) QE is certainly having an impact on the dollar, or at least traders perception of it, so perhaps this theme will persist until the Fed fix the issues in the repo market.
AUD: Net-short exposure has fallen to its lowest level in 2-months, and near similar levels seen in January 2019. And the timing is curious, given the RBA could very well cut rates early February. Still, perhaps this will provide bears with better price to consider short traders, particularly if inflation and / or employment data misses the mark ahead of RBA’s first meeting of the year.
NZD: Traders are on the cusp of flipping to net-long exposure. Moreover, we’ve seen a healthy rise of gross long exposure after shorts were culled between September and December. We continue to expect RBNZ to hold rate through Q1 so core view on NZD remains bullish.
As of Tuesday 7th January:
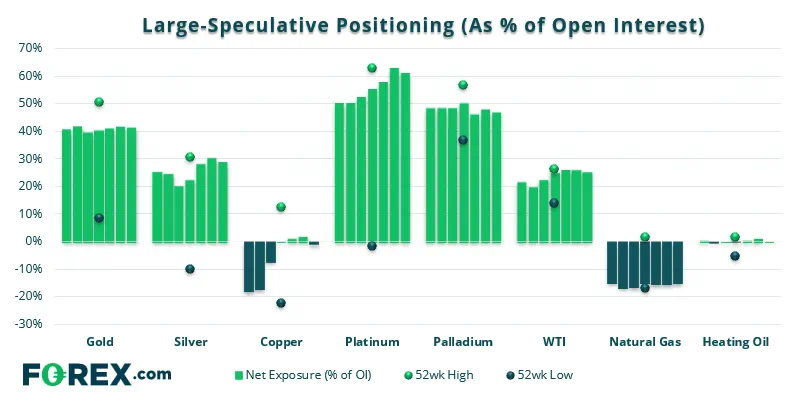
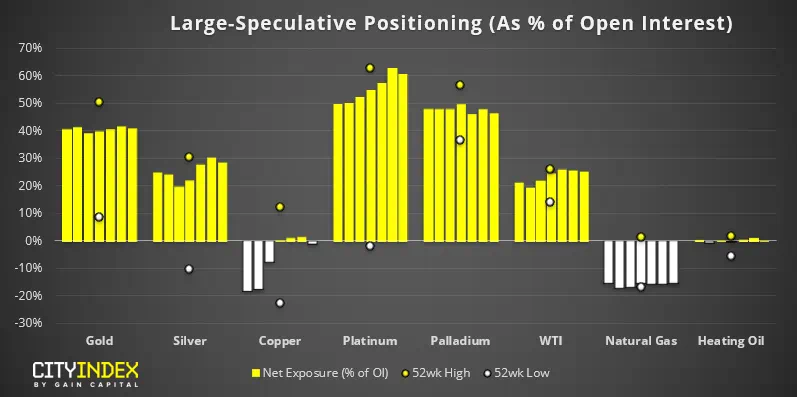
- Copper traders flipped to net-short exposure after just 3-week net long.
- Bullish exposure to platinum hit yet another record high.
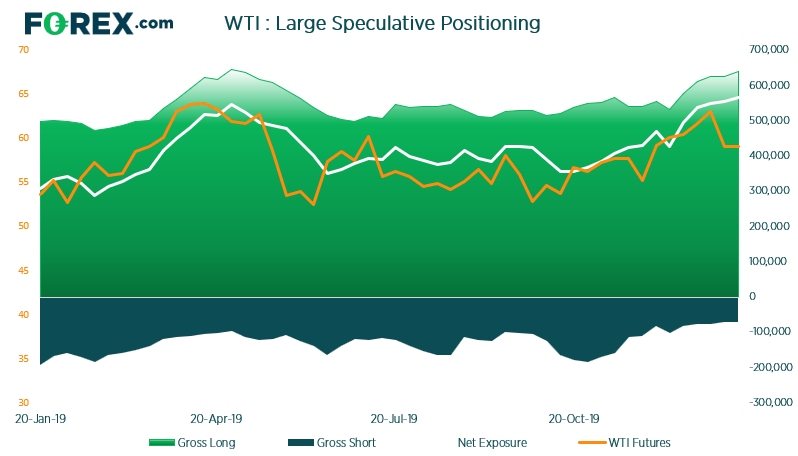
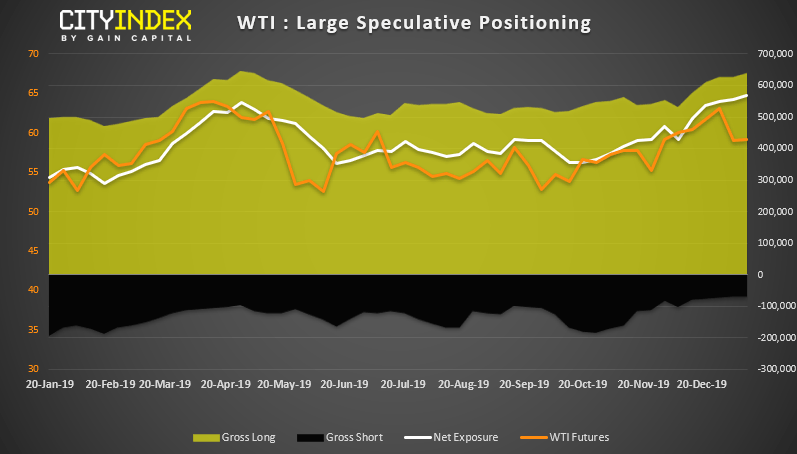
- WTI traders were their most bullish since August 2018.
WTI: Whilst traders increased their bullish exposure to a 17-month high, it should be noted that tensions were high in the Middle East which supported oil prices. Yet with WTI’s failure to close above $64 and roll over, it trades back within range and we’d expect positioning to reflect this in the next report. This means range-trading strategies are preferred whilst prices remain below $64 - $65.
Read our guide on how to interpret the weekly COT report
As of Tuesday 7th January:
- Net-long exposure to USD fell to $4.3 billion. At -$10.2 billion from the prior week, it’s the least bullish investors have been to the dollar since June 2018.
- Traders were the most bullish on GBP since May 2018.
- Large speculators were on the cusp of flipping net-long on NZD.
- Traders were their least bearish on JPY in nearly 3-months.
USD: With traders shedding -$10.2 billion in net-long exposure, it’s the largest weekly change since June 2018 and the largest negative decline since June 2015. It’s also the least bullish traders have been on the dollar in 19-months, since traders flipped to net-long. (Not) QE is certainly having an impact on the dollar, or at least traders perception of it, so perhaps this theme will persist until the Fed fix the issues in the repo market.
AUD: Net-short exposure has fallen to its lowest level in 2-months, and near similar levels seen in January 2019. And the timing is curious, given the RBA could very well cut rates early February. Still, perhaps this will provide bears with better price to consider short traders, particularly if inflation and / or employment data misses the mark ahead of RBA’s first meeting of the year.
NZD: Traders are on the cusp of flipping to net-long exposure. Moreover, we’ve seen a healthy rise of gross long exposure after shorts were culled between September and December. We continue to expect RBNZ to hold rate through Q1 so core view on NZD remains bullish.
As of Tuesday 7th January:
- Copper traders flipped to net-short exposure after just 3-week net long.
- Bullish exposure to platinum hit yet another record high.
- WTI traders were their most bullish since August 2018.
WTI: Whilst traders increased their bullish exposure to a 17-month high, it should be noted that tensions were high in the Middle East which supported oil prices. Yet with WTI’s failure to close above $64 and roll over, it trades back within range and we’d expect positioning to reflect this in the next report. This means range-trading strategies are preferred whilst prices remain below $64 - $65.
Latest market news




The complete CFD trading experience
Award-winning platforms, competitive spreads, low commissions and dedicated support.
We live and breathe the markets and are dedicated to helping traders realise their ambitions as we continue to set the industry bar.
Economic calendar
Web Trader platform
Our sophisticated web-based platform is packed with features.
Related articles
Gold Q4 2026 outlook: Resilience in the face of rallying dollar and yields
As we headed towards the latter stages of Q3 and into Q4, the Fed had just hiked rates in a hawkish FOMC meeting, while the likes of the ECB and BoJ had also tightened their respective policies. Oil prices remained elevated amid the prolonged US-Iran conflict. Meanwhile, bond yields were breaking out, and the dollar was higher across the board. Yet, remarkably, gold was still holding in the positive territory for the third quarter, even if it had weakened somewhat in September.
EUR/USD Q4 2026 Outlook: Euro at a Crossroads as Fed, ECB Tighten 9 25 2026
EUR/USD enters Q4 at a pivotal inflection point as competing Fed-ECB policy paths and persistent inflation risks collide with major technical support.

S&P 500 Forecast: SPX rises as oil prices fall, but treasuries remain at multi-decade highs
U.S. stocks are rising on Friday after a volatile week that saw a surge in Treasury yields ripple through financial markets.
StoneX Europe Ltd may make third party material available on this website which may contain information included but not limited to the conditions of financial markets. The material is for information purposes only and does not contain, and should not be construed as containing, investment advice and/or investment recommendation and/or an investment research and/or an offer of or solicitation for any transactions in financial instruments; any decision to enter into a specific transaction shall be made by the client following an assessment by him/her of their situation.
StoneX Europe Ltd makes no representation or warranty and assumes no liability as to the accuracy or completeness of the information provided, nor any loss arising from any investment based on a recommendation, forecast or other information supplied. You should always seek independent advice as to your suitability to speculate in any related markets and your ability to assume the associated risks, if you are at all unsure. We are not under any obligation to update any such material. Any opinion made may be personal to the author and may not reflect the opinion of StoneX Europe Ltd.