





What is driving the US Dollar higher DXY
With the possibility of a stronger than expected NFP print for May, the DXY has gone bid on taper hopes.
Share this:

The US Dollar Index (DXY) was on a tear today. The US session began with the DXY selling off after Russia announced that they were exiting US Dollars from their Sovereign Wealth Fund. However, that move later reversed, and the DXY turned sharply higher with a better than expected ADP Employment Change figure for May, as well as, with a better than expected initial Jobless Claims figure for the week ending May 29th. Expectations for tomorrows Non-Farm Payrolls for May are +645,000. ( See Matt Weller’s complete NFP Preview HERE). But if good jobs numbers mean a stronger economy, wouldn’t that mean stronger stocks and a weaker US Dollar?
By now you know the story: better data means there is more of a chance that the Fed may do more than just “Talk about talk about tapering”. The worry is that with a better print, the Fed will announce tapering at their June meeting in 2 weeks. Tapering, or decreasing their $120 billion of bond purchases per month, would mean lower bond prices and higher yields. In addition, less support from the Fed would also mean lower stock prices and a higher DXY.
However, the risk for the NFP print is twofold:
1) it is weaker than expected
2) there is a large revision from the horrible April print (+266,000)
We also need to pay attention to the average hourly earnings figure. With higher inflation data lately, the Fed will want to make sure that inflation is feeding through to the employment data before they do anything. They have consistently said that they want to see a string of months of improvement in the labor market, which includes increases in pay. Expectations are 0.2% for May.
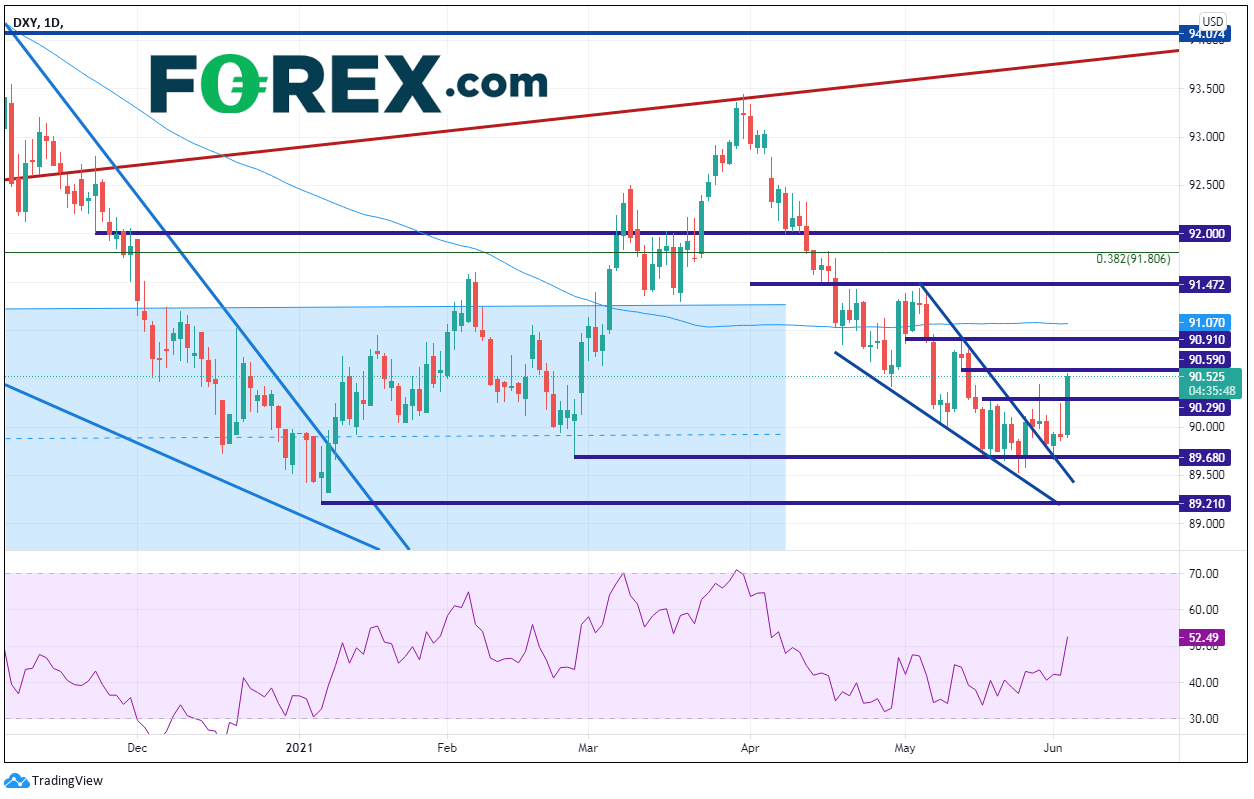
After moving lower for most of 2020, DXY bounced for almost the entire first quarter of 2021. Thus far in the second quarter, the DXY has been moving lower. After hovering around the 200 Day Moving Average near 91 at the end of April/beginning of May, price continued lower in a descending wedge formation. Price broke above the wedge on May 27th, and today, finally accelerated higher away from the wedge. The DXY traded to horizontal resistance today near 90.59.
Source: Tradingview, City Index
What is the US Dollar Index (DXY)?
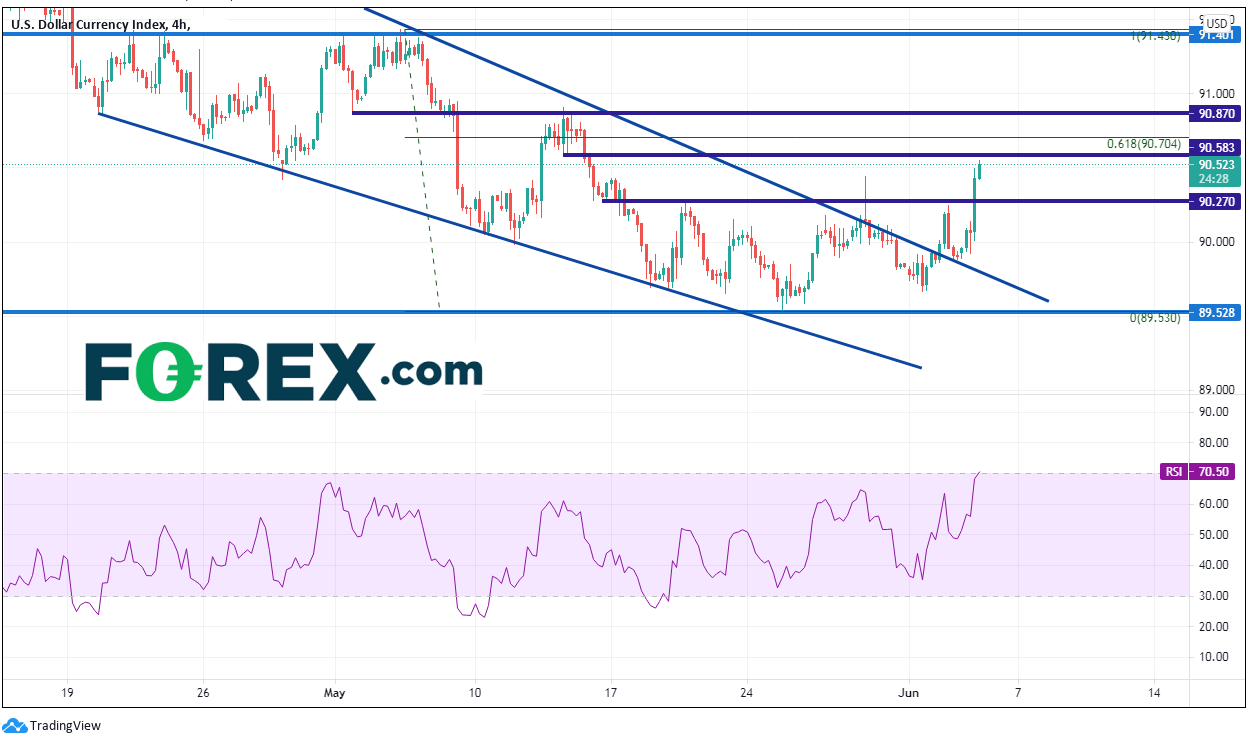
Above there on the 240-minute chart is resistance at the 61.8% Fibonacci retracement level from the highs of May the to the lows of May 25th at 90.70 and then the May 3rd lows near 90.87. Horizontal support below is near 90.27 and the June 2nd lows and trendline support near 89.88. The next support isn’t until the May 25th lows near 89.53.
Source: Tradingview, City Index
With the possibility of a stronger than expected NFP print for May, the DXY has gone bid on taper hopes. Of course, the other reason for the bid could simply be profit taking ahead of the data, as the US Dollar has been falling since the first day of Q2. Watch for revisions to the April print, as well as Average Hourly Earnings for a better gauge on market direction ahead of the Fed in mid-June.
Learn more about forex trading opportunities.
The US Dollar Index (DXY) was on a tear today. The US session began with the DXY selling off after Russia announced that they were exiting US Dollars from their Sovereign Wealth Fund. However, that move later reversed, and the DXY turned sharply higher with a better than expected ADP Employment Change figure for May, as well as, with a better than expected initial Jobless Claims figure for the week ending May 29th. Expectations for tomorrows Non-Farm Payrolls for May are +645,000. ( See Matt Weller’s complete NFP Preview HERE). But if good jobs numbers mean a stronger economy, wouldn’t that mean stronger stocks and a weaker US Dollar?
By now you know the story: better data means there is more of a chance that the Fed may do more than just “Talk about talk about tapering”. The worry is that with a better print, the Fed will announce tapering at their June meeting in 2 weeks. Tapering, or decreasing their $120 billion of bond purchases per month, would mean lower bond prices and higher yields. In addition, less support from the Fed would also mean lower stock prices and a higher DXY.
However, the risk for the NFP print is twofold:
1) it is weaker than expected
2) there is a large revision from the horrible April print (+266,000)
We also need to pay attention to the average hourly earnings figure. With higher inflation data lately, the Fed will want to make sure that inflation is feeding through to the employment data before they do anything. They have consistently said that they want to see a string of months of improvement in the labor market, which includes increases in pay. Expectations are 0.2% for May.
After moving lower for most of 2020, DXY bounced for almost the entire first quarter of 2021. Thus far in the second quarter, the DXY has been moving lower. After hovering around the 200 Day Moving Average near 91 at the end of April/beginning of May, price continued lower in a descending wedge formation. Price broke above the wedge on May 27th, and today, finally accelerated higher away from the wedge. The DXY traded to horizontal resistance today near 90.59.
Source: Tradingview, FOREX.com
What is the US Dollar Index (DXY)?
Above there on the 240-minute chart is resistance at the 61.8% Fibonacci retracement level from the highs of May the to the lows of May 25th at 90.70 and then the May 3rd lows near 90.87. Horizontal support below is near 90.27 and the June 2nd lows and trendline support near 89.88. The next support isn’t until the May 25th lows near 89.53.
Source: Tradingview, FOREX.com
With the possibility of a stronger than expected NFP print for May, the DXY has gone bid on taper hopes. Of course, the other reason for the bid could simply be profit taking ahead of the data, as the US Dollar has been falling since the first day of Q2. Watch for revisions to the April print, as well as Average Hourly Earnings for a better gauge on market direction ahead of the Fed in mid-June.
Learn more about forex trading opportunities.
Related tags:

The complete CFD trading experience
Award-winning platforms, competitive spreads, low commissions and dedicated support.
We live and breathe the markets and are dedicated to helping traders realise their ambitions as we continue to set the industry bar.
Economic calendar
Web Trader platform
Our sophisticated web-based platform is packed with features.
Related articles
Japanese Yen Forecast: USD/JPY 4% Rally Challenges Post-Intervention Downtrend 9 24 2026
USD/JPY momentum has shifted sharply higher, putting a major resistance confluence in focus as U.S. and Japanese event risk builds.

Oil Quietly Hands the Fed a Reason to Stay Hawkish
Oil prices and the U.S. dollar are both on the front foot as elevated energy costs feed Fed warnings that inflation may prove sticky.


S&P 500 forecast: Stocks extend drop as correction risks grow
US and global equity markets have extended Wednesday’s sell-off, with Wall Street opening lower after a weak handover from Asia and Europe. The deterioration in risk appetite has been spreading across global markets. The dollar was firmer, Treasury yields were holding onto yesterday’s gains, while gold, silver and bitcoin were all under pressure alongside equities and major currencies.
StoneX Europe Ltd may make third party material available on this website which may contain information included but not limited to the conditions of financial markets. The material is for information purposes only and does not contain, and should not be construed as containing, investment advice and/or investment recommendation and/or an investment research and/or an offer of or solicitation for any transactions in financial instruments; any decision to enter into a specific transaction shall be made by the client following an assessment by him/her of their situation.
StoneX Europe Ltd makes no representation or warranty and assumes no liability as to the accuracy or completeness of the information provided, nor any loss arising from any investment based on a recommendation, forecast or other information supplied. You should always seek independent advice as to your suitability to speculate in any related markets and your ability to assume the associated risks, if you are at all unsure. We are not under any obligation to update any such material. Any opinion made may be personal to the author and may not reflect the opinion of StoneX Europe Ltd.