I’ve been tracking the British Pound for strength over the past few weeks and in the major pair of GBP/USD, it has not disappointed.
After showing its most oversold reading in more than two years in early-November the pair came to life in a very big way, and as we go into this week’s FOMC rate decision, it’s one of the more attractive major pairs for USD-weakness scenarios.

The pair rallied up to a fresh monthly high last week while re-testing a zone of prior support-turned-resistance, and to start this week we’re seeing a bit of pullback. There’s three support levels of note with 1.3287 an 1.3250 somewhat nearby already, but it’s the support that I looked at in last week’s webinar at 1.3186 that stands out as important, as a clean hold of that level while producing a doji on the daily last Tuesday marks a pivotal spot for bulls to defend.
GBP/USD Daily Chart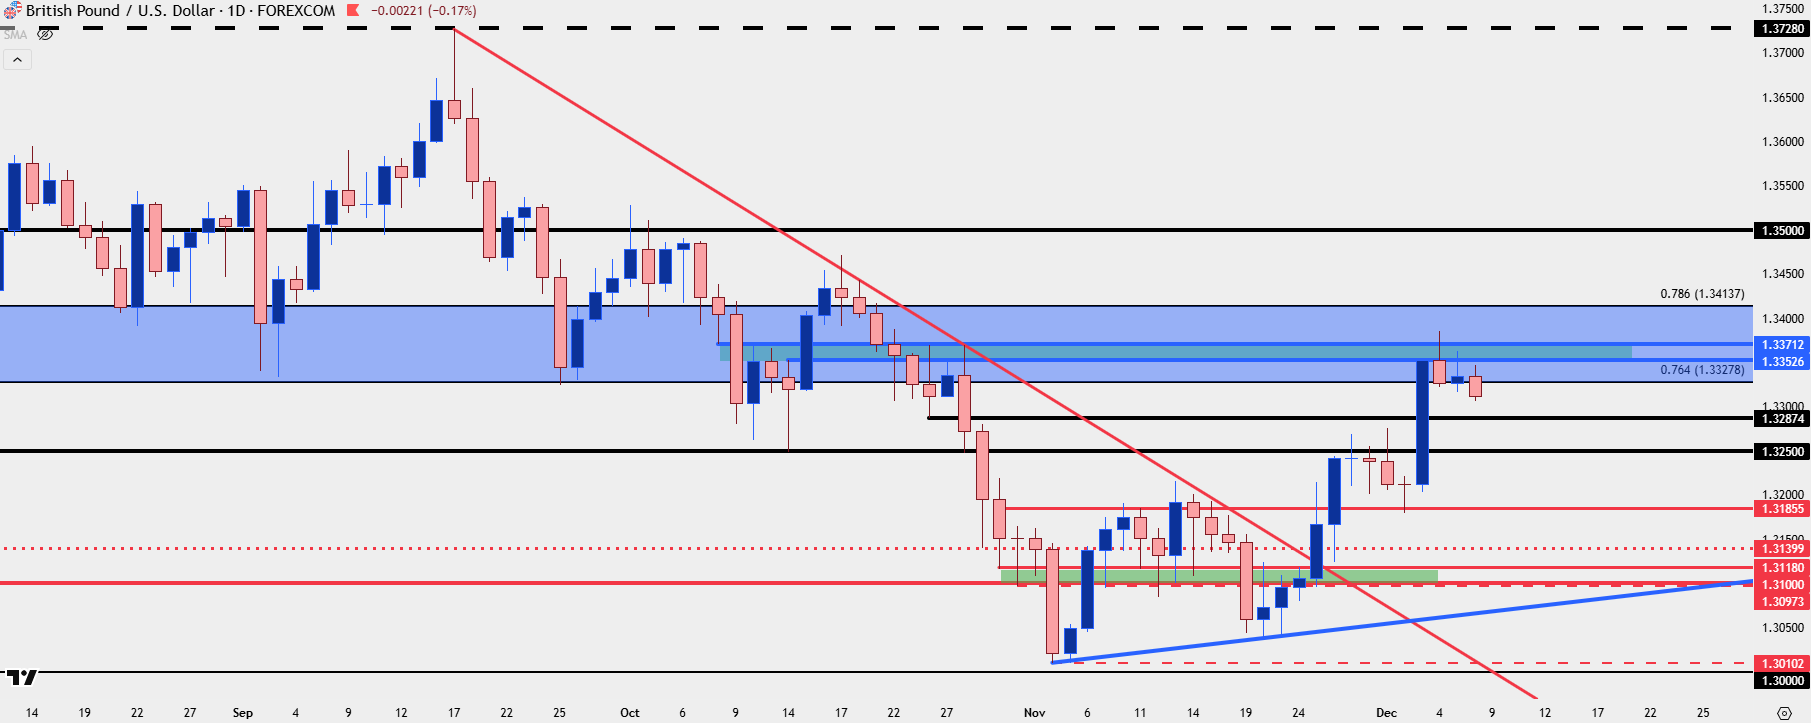
Chart prepared by James Stanley; data derived from Tradingview
GBP/JPY
While USD has pulled back over the past couple of weeks it’s still up on net for Q4; and the currency that’s been even weaker over that period is one that still remains of interest in the Japanese Yen. As I’ve been tracking for USD-strategy, USD/JPY remains one of the more attractive venues for USD-strength scenarios so juxtaposing the above two themes, of GBP/USD of preference for USD-weakness and USD/JPY for USD-strength, we can simply remove the Dollar from the mix to arrive at GBP/JPY for cross-currency themes.
And to be sure, the pair has put in quite the rally over the past month after finally breakout out from the 204 level that had held as resistance in late-October.
Now the pair is in another key zone and this is the same the stymied the advance last year, built around the wick from the reversal candle last July and it runs from 206 up to 208.12.
GBP/JPY Weekly Chart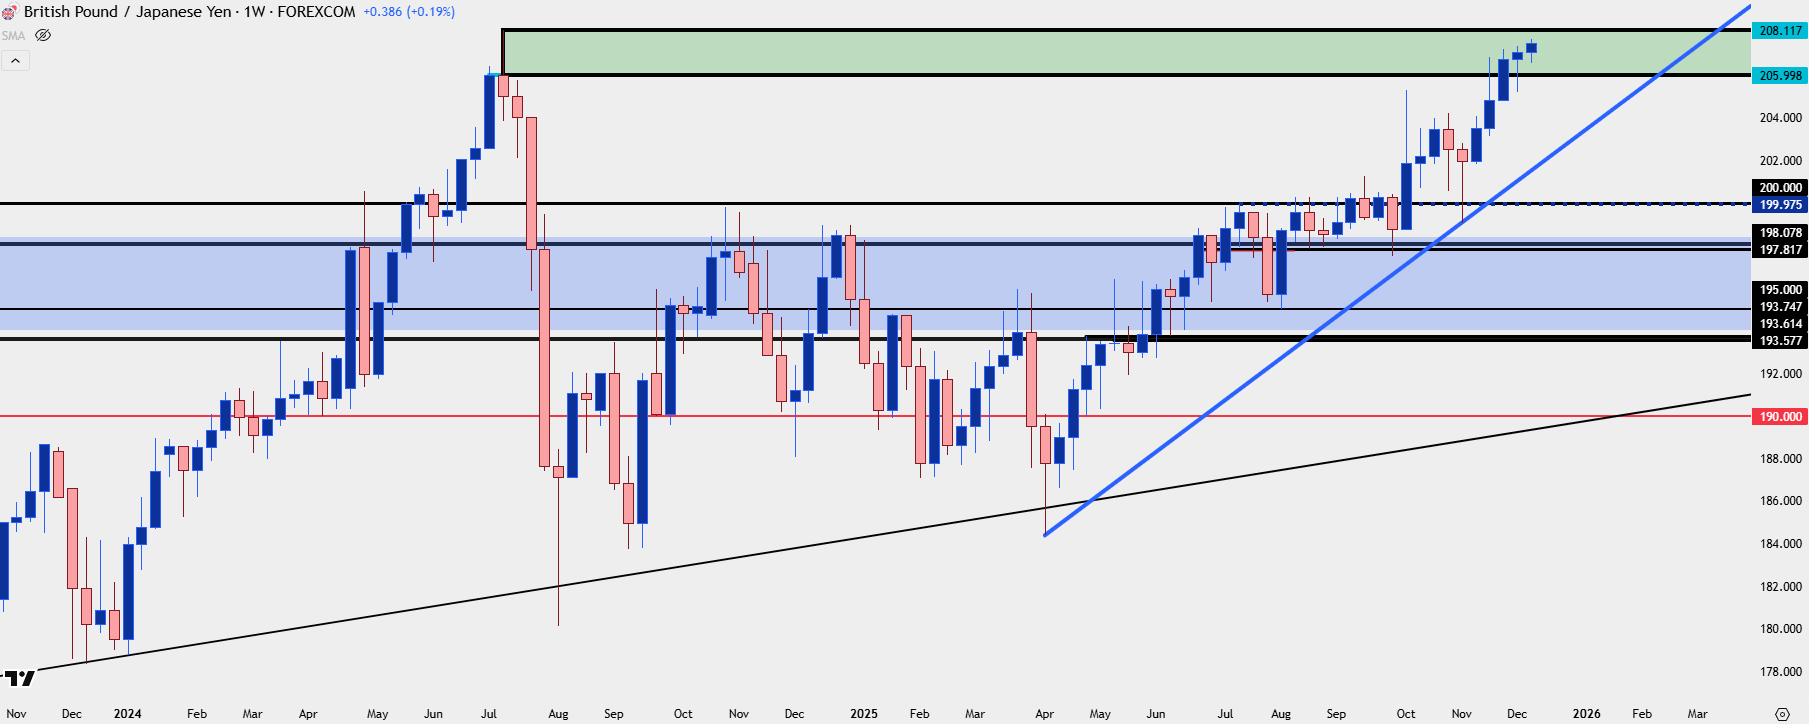
Chart prepared by James Stanley; data derived from Tradingview
GBP/JPY Shorter-Term
The challenge with GBP/JPY now is not only the longer-term zone that the pair is trading within, but also the fact that pullbacks have been rather light, and rallies have slowed as price has pushed up to next resistance. This hasn’t quite built a rising wedge as there’s no clear upper trendline, but the tonality of such a formation is there. So this doesn’t necessarily rule out bullish continuation, but it does caution against chasing breakouts or fresh highs, for now at least, until buyers are able to convincingly punch through 208.12. Shorter-term, there’s still support interest at 206.70 or maybe even 207.20, if the trader wanted to push the theme aggressively.
GBP/JPY Four-Hour Chart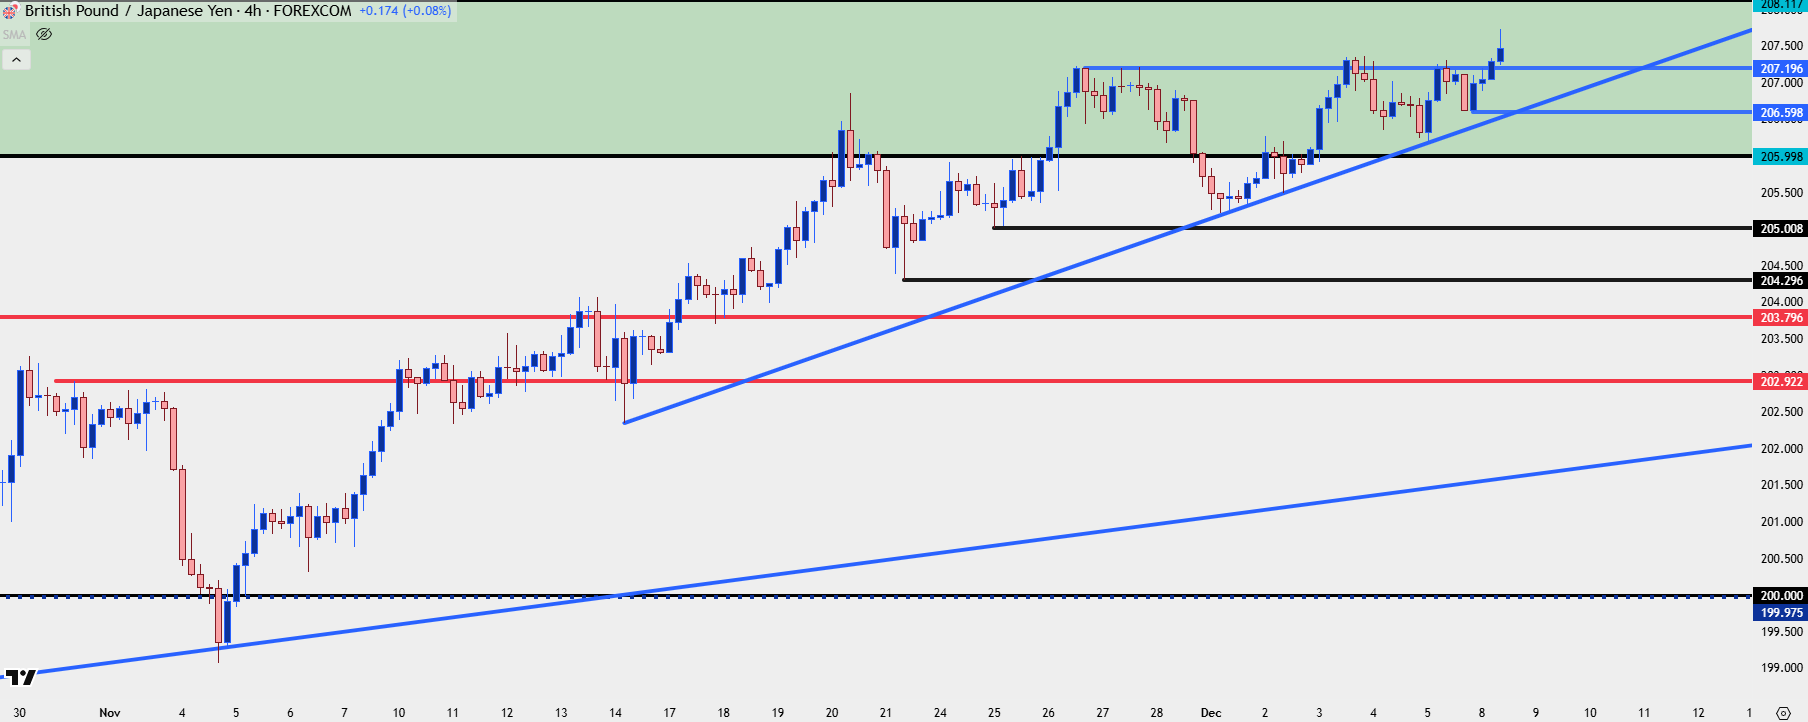
Chart prepared by James Stanley; data derived from Tradingview
EUR/GBP
When I brought this one into the GBP mix in last month’s Technical Analysis article, the pair was trading very near a fresh two-and-a-half year high. I was looking at a spot of support potential from prior resistance and that zone is now in-play, plotted from around .8739-.8753.
Where this one comes in as interesting in my opinion is for those that would be looking to fade this recent run of GBP-strength. Given that we’re already testing a big zone of support as taken from prior resistance, there’s scope for bullish scenarios, although its still early and price is technically trading inside of the zone at the moment.
EUR/GBP Weekly Chart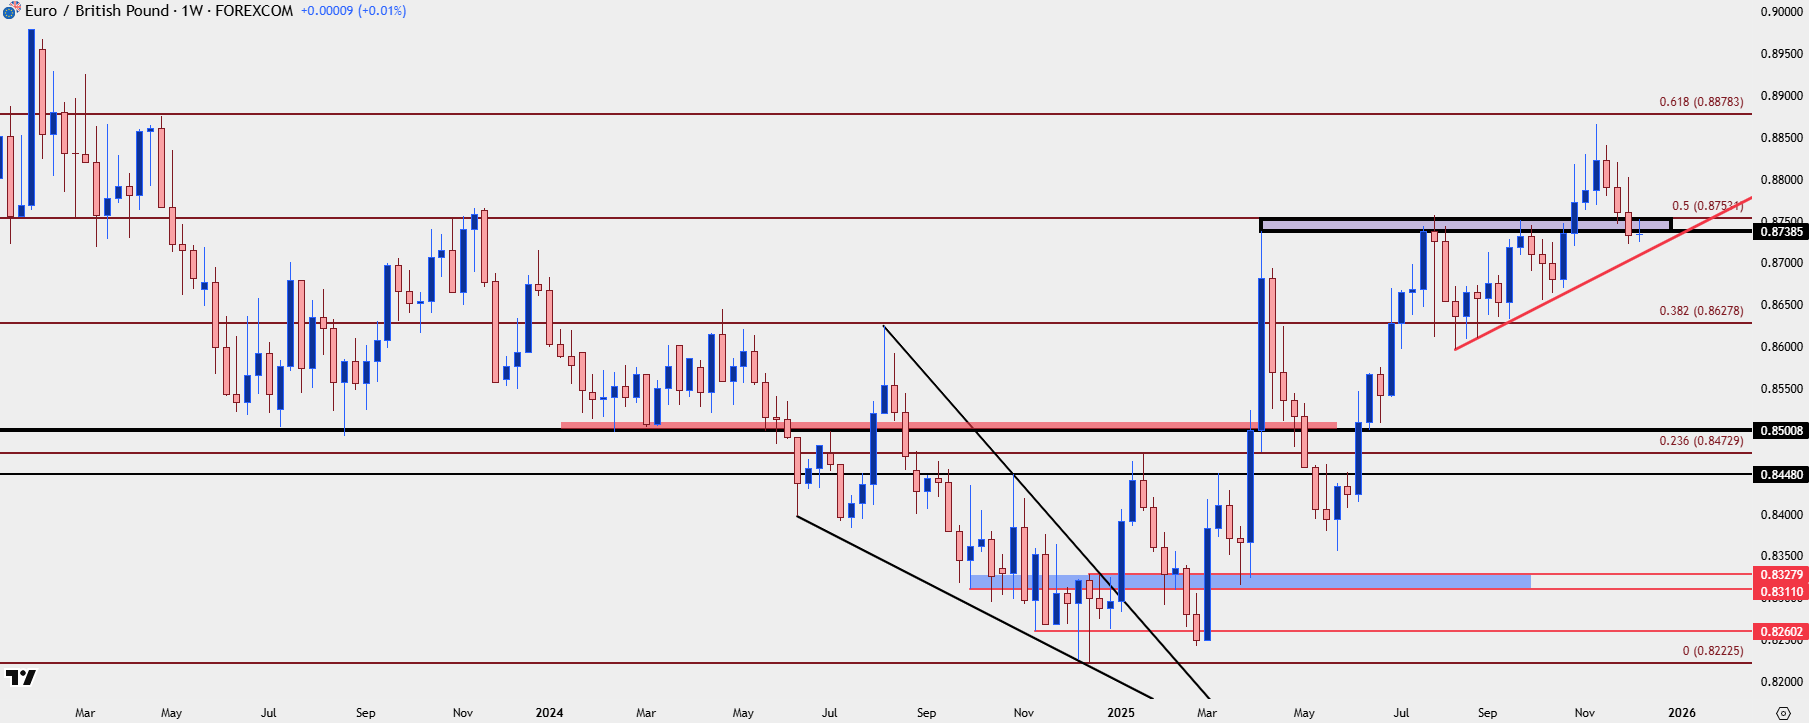
Chart prepared by James Stanley; data derived from Tradingview
EUR/GBP Daily
To put some additional detail to the above, we can’t quite say that a low is in place yet, but there could be the early stages of such a setup. From the daily chart we can see underside wicks for the past two completed daily candles, and another for today, so far. These are holding at higher-lows and bulls even took a shot today to take control, although were rebuffed at the Fibonacci level of .8753. So, again, it’s still early, but if we can see buyers push a higher-high on the daily, particularly if they can force a daily close above .8753, it’ll look like a possible bullish reversal from the daily and that will speak to the pullback setup looked at on the weekly chart above.
EUR/GBP Daily Chart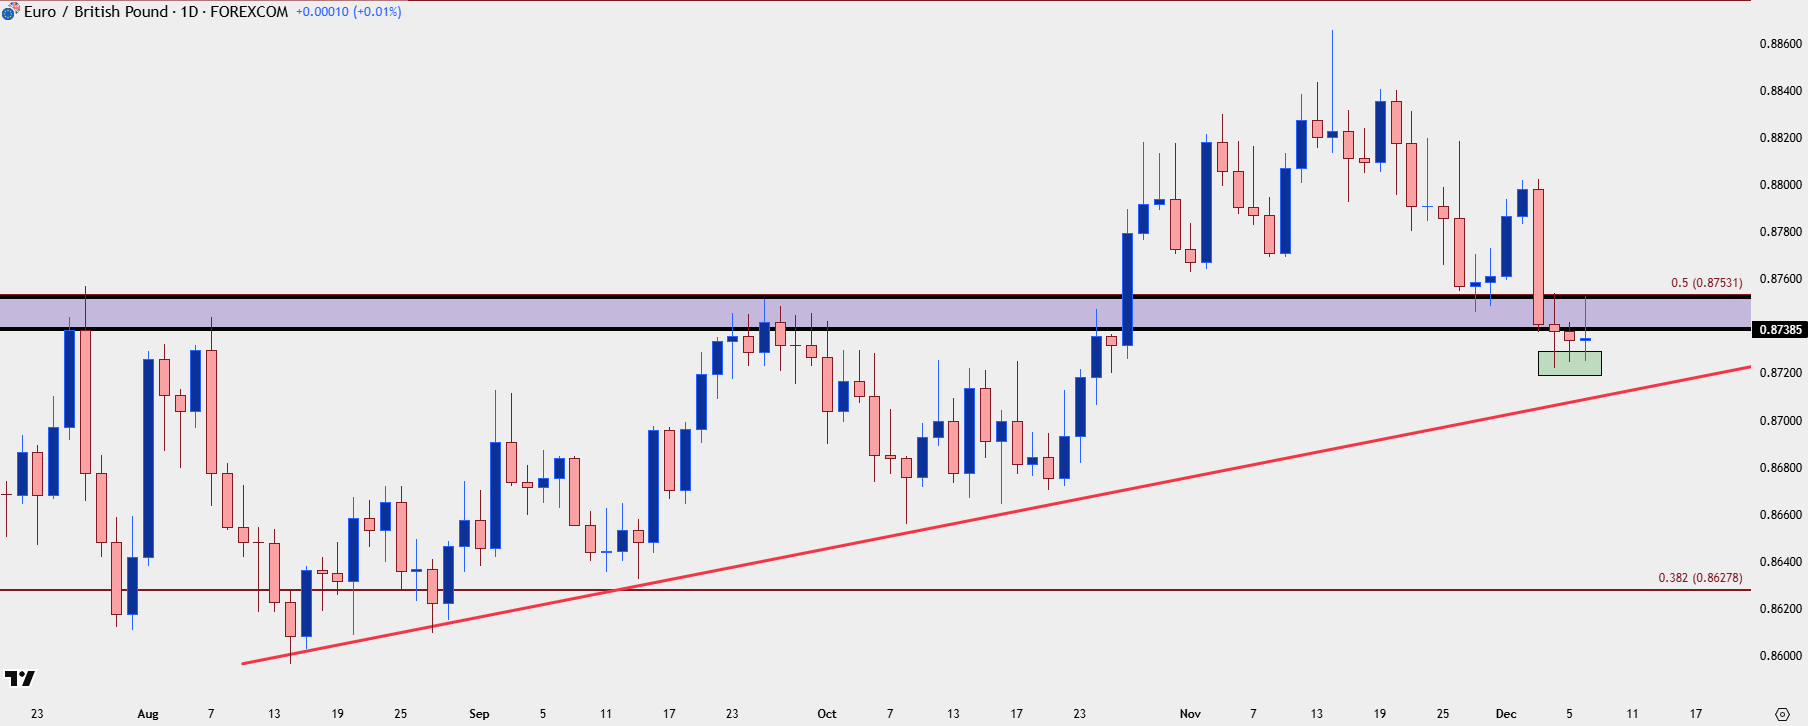
Chart prepared by James Stanley; data derived from Tradingview
--- written by James Stanley, Senior Market Analyst, Global Macro