The US Dollar retains a bullish look from the daily chart with a continued sequence of higher-highs and lows since the Fed’s rate cut last month. A familiar Fibonacci level is in-play at 98.98, which was setting support last week and is now showing as short-term resistance. The double bottom in EUR/USD from last week’s webinar and the falling wedge in GBP/USD have both cleared, but at this point, GBP/USD looks more attractive for USD-weakness scenarios given the hold of support at prior resistance. For USD-strength, I’m still tracking USD/JPY and USD/CAD is of interest, although a pullback test to the 1.4000 handle may be needed before topside continuation is attractive again there.
USD
The US Dollar was in a hard sell-off earlier in the year but since setting a low in April, bears haven’t been able to get much run. This has led to the build of a falling wedge formation that gave way a couple weeks ago, but as looked at in last week’s webinar, prices in DXY were already testing resistance at 99.40, and the 100.00 level lurks overhead.
US Dollar Daily Chart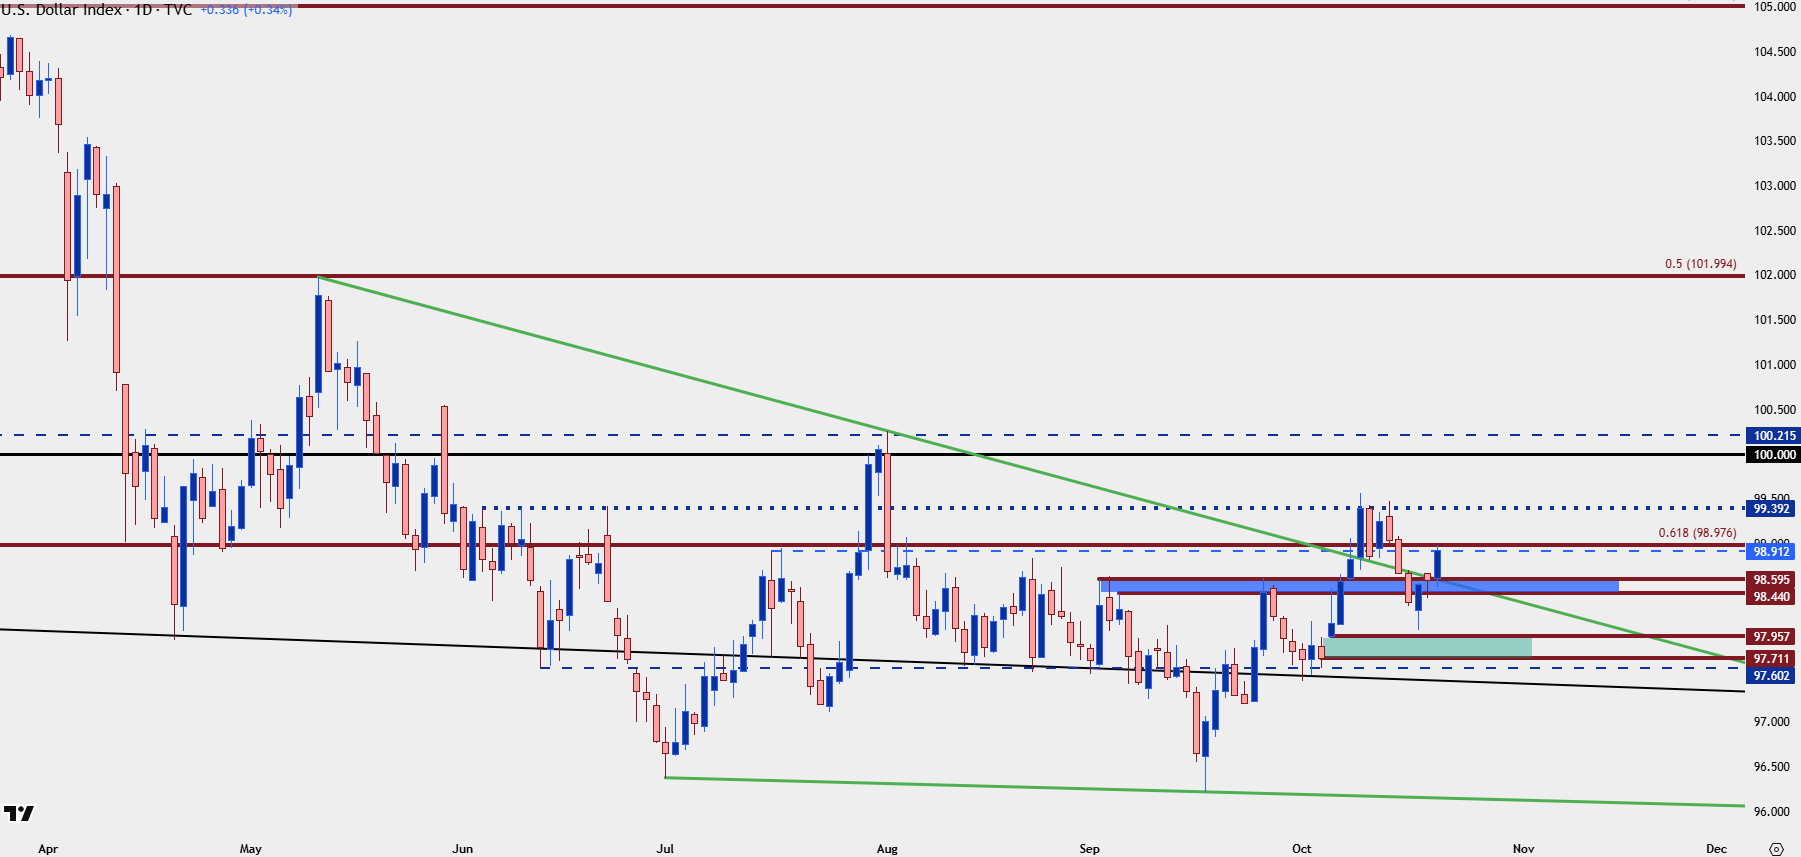
Chart prepared by James Stanley; data derived from Tradingview
The pullback from that has so far held above the ‘s3’ zone from last week’s webinar and from both the daily and two-hour charts, bullish trends remain viable. The four-hour chart is a different story at this point and this is what puts so much emphasis on that 98.98 Fibonacci level, as this resistance from prior support is a key line in the sand for bulls to take out if they’re going to show greater control.
US Dollar Four-Hour Chart
Chart prepared by James Stanley; data derived from Tradingview
EUR/USD
Like the USD above EUR/USD is in a position that can be justified in either direction. The daily and two hour charts highlight bearish tendency while the four-hour retains an open door for strength.
Notably, the double bottom formation looked at last week cleared and ran to target, but since then, it’s been largely a one-way move in the pair as sellers have started to take back over.
The neckline for that formation is now a big spot, from 1.1631 up to 1.1646, as this represents an area for lower-high resistance. If bulls can power through that, it’ll look more optimistic for upside and conversely, this would speak to the bearish scenario in the USD from the four-hour chart.
EUR/USD Two-Hour Chart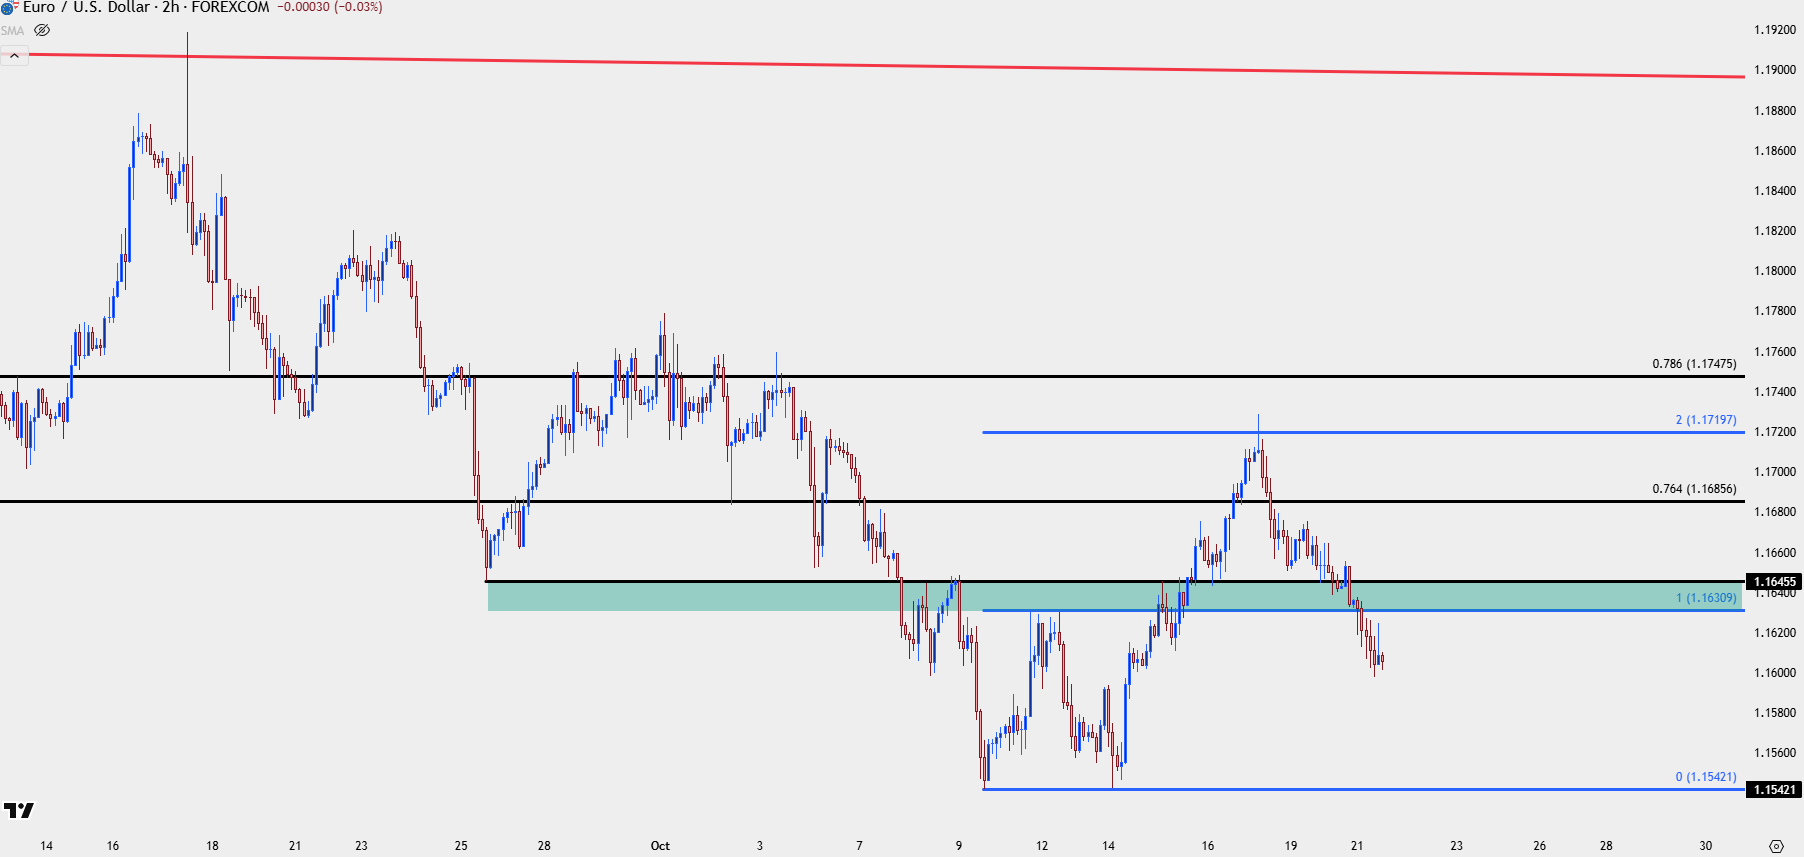
Chart prepared by James Stanley; data derived from Tradingview

EUR/USD Daily
The 1.1686 Fibonacci level remains a major spot and so far, that’s helping to hold another lower-high. As I said in the webinar the previous week, it was 1.1748 that set up invalidation as that had held five days of resistance at a key Fibonacci level. The 1.1686 level is the 76.4% retracement from that same study, and this is something that’s been in-play for a couple years now as the 61.8% set the high in 2023 and the 23.6% retracement set the low earlier this year.
This was featured as part of the larger explainer article on the topic of Fibonacci that I published back in February, and eight months later it’s still in-play.
EUR/USD Daily Chart
Chart prepared by James Stanley; data derived from Tradingview
GBP/USD
While EUR/USD had built a double bottom last week, GBP/USD had set up in a falling wedge. And notably, the resistance at that point is now support today, when compared to the short-term EUR/USD chart above, illustrates additional Euro weakness.
As such, GBP/USD is still my preference for USD-weakness setups at this point and the next key resistance overhead is at 1.3414 and then the 1.3500 level, while support plots at 1.3328 followed by 1.3250.
GBP/USD Four-Hour Chart
Chart prepared by James Stanley; data derived from Tradingview
USD/JPY
I wrote about USD/JPY yesterday and last week, I was tracking the 150.00 level as key support. That was tested on Friday and since then bulls have started to take over more and more, highlighting the pair as one of the more attractive venues for USD-strength scenarios. And extrapolating on that, JPY-weakness could be of attraction in both EUR/JPY and GBP/JPY, with the latter breaking out of a bull flag formation that set up with last week’s pullback.

USD/JPY Daily Chart
Chart prepared by James Stanley; data derived from Tradingview
USD/CAD
I’ve been pressing the long side of USD/CAD for a couple months now but the complication at this point is one of chart position. Price has grinded above the 1.4000 level but the long side has started to feel a bit over-crowded, and that’s allowed for the build of a falling wedge. As such, I’d like to see a pullback here so that I can further monitor bullish continuation scenarios, with preference being a support hold at the 1.3981-1.4000 area, but if that doesn’t happen, looking for a re-test of the zone around the 1.3900 handle.
USD/CAD Daily Chart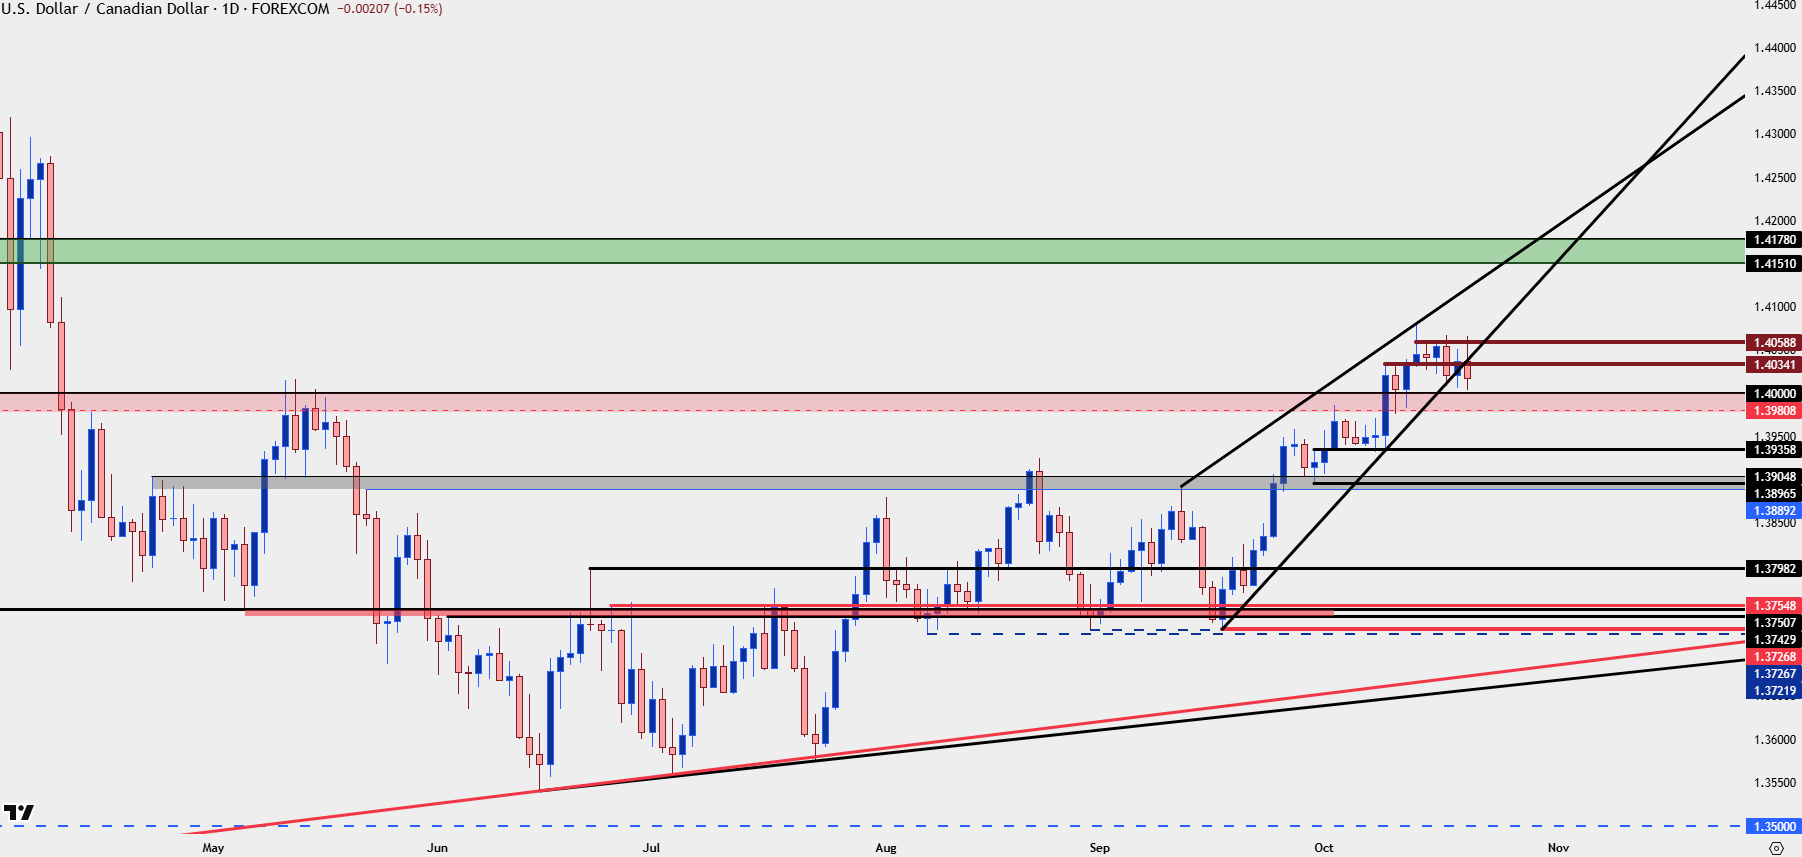
Chart prepared by James Stanley; data derived from Tradingview
--- written by James Stanley, Senior Strategist