



ASX 200 Morning Market Outlook: SPI Futures Track Wall Street Lower
ASX 200 futures dip with Wall Street as traders square positions ahead of US earnings. Materials hit record highs, but Financials lag.
Share this:

The ASX 200 rallied modestly on Thursday, snapping a three-day losing streak as Materials (XMJ) reached a record high. However, ASX 200 futures (SPI 200) turned lower overnight alongside Wall Street indices, as traders booked profits ahead of the weekend and the start of US earnings season. With volatility typically rising on Fridays, short-term traders should brace for potential swings as Financials continue to soften.
View related analysis:
View related analysis:
ASX 200 Outlook: Bulls Lose Momentum as SPI Futures Follow Wall Street
ASX 200 Market Snapshot
- The ASX 200 rose on Thursday in line with my bias, snapping a three-day losing streak, although the 0.25% gain was modest.
- The ASX 200 cash market is on track to finish the week with a spinning-top doji candle if prices hold near current levels.
- Seven of the eleven sectors advanced, led by Materials (XMJ), which closed at a record high.
- Four sectors declined, led by Utilities (XUJ) and Financials (XFJ).
- However, ASX 200 futures (SPI 200) were lower overnight alongside Wall Street indices as traders squared up their books ahead of the weekend and US earnings season.
- Historical data shows that Fridays are typically the second most volatile day of the week, based on both the one-year and three-month average daily ranges.

Chart analysis by Matt Simpson - data source: ASX, LSEG


ASX 200 Sector Analysis: Financials and Materials Diverge
With Financials (XFJ) and Materials (XMJ) together accounting for more than half of the ASX 200’s total weighting, their trends are critical in gauging the index’s broader strength. The Materials sector has reached a fresh record high, while Financials are retracing from near-record levels — a clear sign of divergence between the market’s two heavyweight components.
This split reinforces yesterday’s view that upside on the ASX 200 may be limited in the short term. A brief pullback or period of consolidation may be needed before a sustained breakout to new highs can occur. Traders may therefore wish to stay nimble and avoid assuming an immediate continuation higher while Financials remain under pressure.
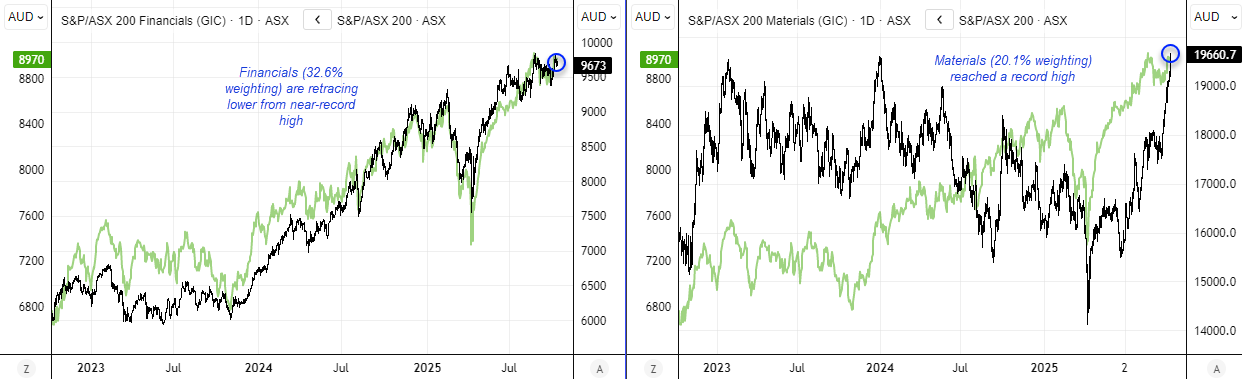
Chart analysis by Matt Simpson - data source: ASX, LSEG
ASX 200 Technical Analysis
The pullback from the recent, short-lived record high continues, with ASX 200 futures once again trading below the 9,000 level and testing the September high near 8,939 for potential support.
The 8,839–8,949 zone may offer initial buying interest, but the one-hour trend structure still leans bearish, suggesting the ASX 200 could extend lower in the near term. The 9,000 handle and monthly R1 pivot (8,989) now form a resistance area that bears may look to fade into. A confirmed break beneath the September high could open the door to a move toward the 8,890 swing high or the monthly pivot point near 8,870.

Chart analysis by Matt Simpson - Source: TradingView, ASX SPI 200 Index Futures
View the full economic calendar
View the full economic calendar
-- Written by Matt Simpson
Follow Matt on Twitter @cLeverEdge
How to trade with City Index
You can trade with City Index by following these four easy steps:
- Open an account, or log in if you’re already a customer
• Open an account in the UK
• Open an account in Australia
• Open an account in Singapore
- Search for the market you want to trade in our award-winning platform
- Choose your position and size, and your stop and limit levels
- Place the trade
Related tags:
Latest market news




Open an account in minutes
Experience award-winning platforms with fast and secure execution.
Economic calendar
Web Trader platform
Our sophisticated web-based platform is packed with features.
Related articles
S&P 500, Nasdaq 100 Claw Back But NVDA Cloud Looms Overhead
Last week was green for both the Nasdaq and S&P 500 but given the sell-off that led into that bounce there’s still a very real question as to whether bears still have a statement to make. And the NVDA situation presents a very real threat.

Gold, EUR/USD hit 2026 lows as US yields erupt
US Treasury yields have staged one of their largest four-session increases in decades, hammering EUR/USD and gold. But while the euro's decline makes sense, gold's reaction has been extraordinary.


Nasdaq 100 forecast: Nvidia troubles put AI recovery into question
The recovery for major indices this week has helped repair much of the technical damage inflicted by last week’s sell-off, but the latest developments with Nvidia suggest investors are not quite ready to put the underlying risks behind them. The Nasdaq 100 led other US index futures lower overnight, with falls of around 0.8%.

The information on this web site is not targeted at the general public of any particular country. It is not intended for distribution to residents in any country where such distribution or use would contravene any local law or regulatory requirement. The information and opinions in this report are for general information use only and are not intended as an offer or solicitation with respect to the purchase or sale of any currency or CFD contract. All opinions and information contained in this report are subject to change without notice. This report has been prepared without regard to the specific investment objectives, financial situation and needs of any particular recipient. Any references to historical price movements or levels is informational based on our analysis and we do not represent or warranty that any such movements or levels are likely to reoccur in the future. While the information contained herein was obtained from sources believed to be reliable, author does not guarantee its accuracy or completeness, nor does author assume any liability for any direct, indirect or consequential loss that may result from the reliance by any person upon any such information or opinions.
Futures, Options on Futures, Foreign Exchange and other leveraged products involves significant risk of loss and is not suitable for all investors. Losses can exceed your deposits. Increasing leverage increases risk. Spot Gold and Silver contracts are not subject to regulation under the U.S. Commodity Exchange Act. Contracts for Difference (CFDs) are not available for US residents. Before deciding to trade forex, commodity futures, or digital assets, you should carefully consider your financial objectives, level of experience and risk appetite. Any opinions, news, research, analyses, prices or other information contained herein is intended as general information about the subject matter covered and is provided with the understanding that we do not provide any investment, legal, or tax advice. You should consult with appropriate counsel or other advisors on all investment, legal, or tax matters. References to FOREX.com or GAIN Capital refer to StoneX Group Inc. and its subsidiaries. Please read Characteristics and Risks of Standardized Options.