





Australian Dollar (AUD/USD) Techs: Aussie Bulls Tempt a Larger Turn
The past two monthly bars in AUD/USD have been indecisive but more recently, as USD-strength has come back to life, the Aussie has held its own quite well.
Share this:

AUD/USD Talking Points:
- AUD/USD has shown indecision on the past two monthly bars, which isn’t a very common occurrence on the longer time frame.
- Proximity to key swing lows makes that scenario of interest for possible topside swing setups.
- More recently, AUD/USD has held up relatively well as USD-strength has come rushing back. In the video and article below, I look at shorter-term support structure that, if respected, could allow for bullish swing setups.
AUD/USD was hit hard in the 4th quarter of last year, as USD-strength came back online in a big way. The pair was plummeting into the yearly open, but so far in 2025, bears haven’t had much room to run and from the monthly chart, there’s been a clear show of indecision.
I think the .6000 handle still looms large here as there’s been very few historical tests below that big figure. There was the instance around Covid, of course, and in that case, the pair held up just ten pips above the next major psychological level down of .5500. The .6000 test didn’t last for long, either, as the pair quickly snapped above and ran all the way until prices finally found resistance at the .7750 level.
That price was in-play for seven months – and bulls were unable to evoke a single monthly close above that level. And that failure eventually led into a bearish swing as prices slalomed on the way down towards that .6000 level again. But, this time, sellers suddenly got shy as the price got near, and in October of 2022, a low was set at .6170, a price that remains relevant today.
AUD/USD Monthly Price Chart
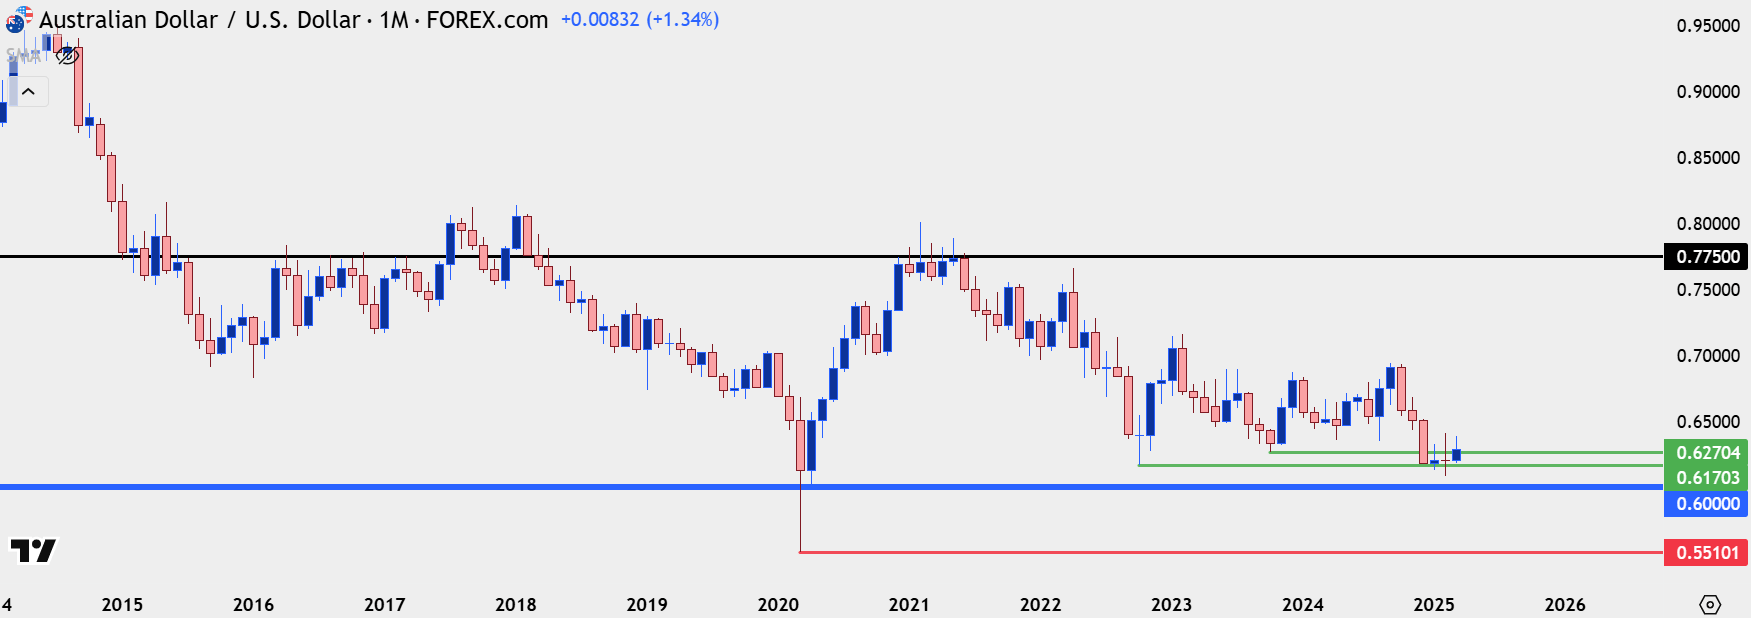 Chart prepared by James Stanley; data derived from Tradingview
AUD/USD Weekly
The bounce from .6170 was able to once again test above the .7000 handle, but not for very long. There was a single monthly (and weekly) close above that price after the bounce, and that was in January of 2023, after which sellers attacked. The bearish engulf that pushed prices back-below led into a prolonged sell-off, which led to the 2023 low 100 pips above the prior year’s low, once again in October of that year.
The pair had held up fairly well after that, at least until the Q4 open last year. And as that larger round of USD-reversals began to show AUD/USD was not left unscathed, with another bearish engulfing candlestick on the weekly chart leading to a prolonged sell-off, that pushed all the way into the open of the New Year.
AUD/USD Weekly Chart
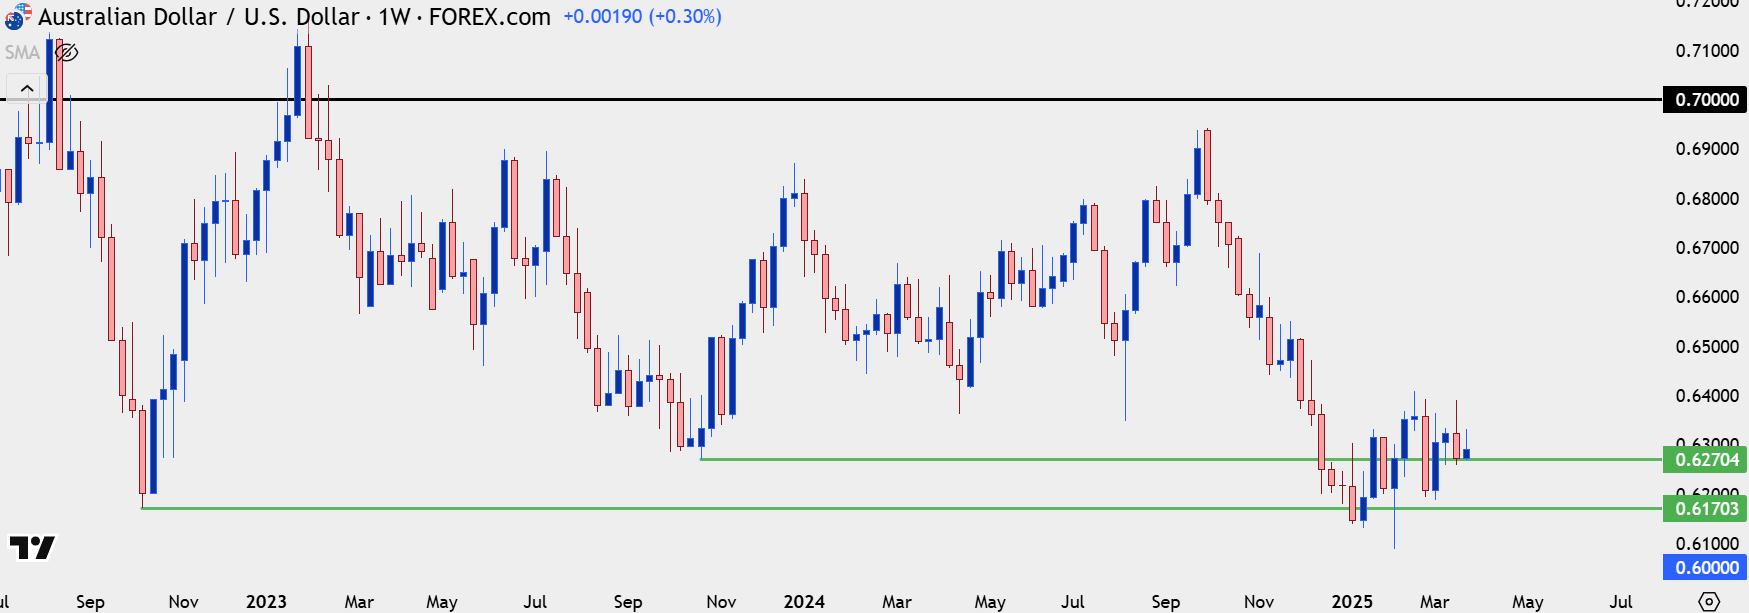 Chart prepared by James Stanley; data derived from Tradingview
AUD/USD
Those prices from the 2022 and 2023 swing lows retain some relevance today.
There was a single daily close below the 2022 low of .6170 after the 2025 open, and that led to a fast push up to a higher-high. The pullback from that again showed an element of support at .6170, with .6270 coming in as support after.
To date, bulls haven’t exactly been able to substantiate much run in the pair – but there has been the slowing of bearish pressure as sellers have shied away with those longer-term supports in the picture. And that’s the type of that that can eventually lead to a bullish reversal.
More recently, .6270 has helped to set the low so far this week; and from that, we can begin to set up a shorter-term backdrop that may allow for some strategy implementation.
AUD/USD Daily Chart
 Chart prepared by James Stanley; data derived from Tradingview
AUD/USD Shorter-Term Strategy
At this point the situation is pretty clear, where sellers have started to stall but bulls haven’t exactly been able to take over yet. From a shorter-term basis, however, there may be an opening door for a larger reversal, especially if we see USD-weakness come back into the picture.
So far this week the USD has continued to show higher-highs and lows, and that’s impacted EUR/USD and GBP/USD: But, notably, AUD/USD has also been putting in higher-highs and lows. And from the four-hour chart we can see some recent support structure that could allow for bullish swing setups, drawing on that .6270 longer-term level to help with setting support.
That .6270 level was clearly in the picture earlier in March on two separate occasions. More recently, the Friday swing low last week held with respect to .6258, and that’s the level that bulls need to hold above to retain control. Ideally, support swings will remain above .6270 and even better, above the .6278 swing low from last night.
AUD/USD Four-Hour Chart
 Chart prepared by James Stanley; data derived from Tradingview
--- written by James Stanley, Senior Strategist
AUD/USD Talking Points:
- AUD/USD has shown indecision on the past two monthly bars, which isn’t a very common occurrence on the longer time frame.
- Proximity to key swing lows makes that scenario of interest for possible topside swing setups.
- More recently, AUD/USD has held up relatively well as USD-strength has come rushing back. In the video and article below, I look at shorter-term support structure that, if respected, could allow for bullish swing setups.
AUD/USD was hit hard in the 4th quarter of last year, as USD-strength came back online in a big way. The pair was plummeting into the yearly open, but so far in 2025, bears haven’t had much room to run and from the monthly chart, there’s been a clear show of indecision.
I think the .6000 handle still looms large here as there’s been very few historical tests below that big figure. There was the instance around Covid, of course, and in that case, the pair held up just ten pips above the next major psychological level down of .5500. The .6000 test didn’t last for long, either, as the pair quickly snapped above and ran all the way until prices finally found resistance at the .7750 level.
That price was in-play for seven months – and bulls were unable to evoke a single monthly close above that level. And that failure eventually led into a bearish swing as prices slalomed on the way down towards that .6000 level again. But, this time, sellers suddenly got shy as the price got near, and in October of 2022, a low was set at .6170, a price that remains relevant today.
AUD/USD Monthly Price Chart
AUD/USD Weekly
The bounce from .6170 was able to once again test above the .7000 handle, but not for very long. There was a single monthly (and weekly) close above that price after the bounce, and that was in January of 2023, after which sellers attacked. The bearish engulf that pushed prices back-below led into a prolonged sell-off, which led to the 2023 low 100 pips above the prior year’s low, once again in October of that year.
The pair had held up fairly well after that, at least until the Q4 open last year. And as that larger round of USD-reversals began to show AUD/USD was not left unscathed, with another bearish engulfing candlestick on the weekly chart leading to a prolonged sell-off, that pushed all the way into the open of the New Year.
AUD/USD Weekly Chart
AUD/USD
Those prices from the 2022 and 2023 swing lows retain some relevance today.
There was a single daily close below the 2022 low of .6170 after the 2025 open, and that led to a fast push up to a higher-high. The pullback from that again showed an element of support at .6170, with .6270 coming in as support after.
To date, bulls haven’t exactly been able to substantiate much run in the pair – but there has been the slowing of bearish pressure as sellers have shied away with those longer-term supports in the picture. And that’s the type of that that can eventually lead to a bullish reversal.
More recently, .6270 has helped to set the low so far this week; and from that, we can begin to set up a shorter-term backdrop that may allow for some strategy implementation.
AUD/USD Daily Chart
AUD/USD Shorter-Term Strategy
At this point the situation is pretty clear, where sellers have started to stall but bulls haven’t exactly been able to take over yet. From a shorter-term basis, however, there may be an opening door for a larger reversal, especially if we see USD-weakness come back into the picture.
So far this week the USD has continued to show higher-highs and lows, and that’s impacted EUR/USD and GBP/USD: But, notably, AUD/USD has also been putting in higher-highs and lows. And from the four-hour chart we can see some recent support structure that could allow for bullish swing setups, drawing on that .6270 longer-term level to help with setting support.
That .6270 level was clearly in the picture earlier in March on two separate occasions. More recently, the Friday swing low last week held with respect to .6258, and that’s the level that bulls need to hold above to retain control. Ideally, support swings will remain above .6270 and even better, above the .6278 swing low from last night.
AUD/USD Four-Hour Chart
--- written by James Stanley, Senior Strategist
Related tags:



Open an account in minutes
Experience award-winning platforms with fast and secure execution.
Economic calendar
Web Trader platform
Our sophisticated web-based platform is packed with features.
Related articles
Australian Dollar Forecast: AUD/USD Breaks Multi-Month Range, Hits 10-Month Low 11 14 2026
Aussie bears are closing in on major technical support, with next week's Australian employment data raising the stakes for a pivotal reaction.

US Dollar Price Action Setups: EUR/USD, USD/JPY
The US Dollar broke out to a fresh yearly high after the CPI report, and that Dollar strength was on full view in pretty much all major pairings with a particular push in EUR/USD.

AUD/USD Outlook: Historic yield squeeze leaves Aussie bears in control
Australian bond yields have fallen below their US equivalents as the Fed's hawkish repricing gathers momentum. With the Aussie weakening broadly, technical signals suggest sellers remain in control.

The information on this web site is not targeted at the general public of any particular country. It is not intended for distribution to residents in any country where such distribution or use would contravene any local law or regulatory requirement. The information and opinions in this report are for general information use only and are not intended as an offer or solicitation with respect to the purchase or sale of any currency or CFD contract. All opinions and information contained in this report are subject to change without notice. This report has been prepared without regard to the specific investment objectives, financial situation and needs of any particular recipient. Any references to historical price movements or levels is informational based on our analysis and we do not represent or warranty that any such movements or levels are likely to reoccur in the future. While the information contained herein was obtained from sources believed to be reliable, author does not guarantee its accuracy or completeness, nor does author assume any liability for any direct, indirect or consequential loss that may result from the reliance by any person upon any such information or opinions.
Futures, Options on Futures, Foreign Exchange and other leveraged products involves significant risk of loss and is not suitable for all investors. Losses can exceed your deposits. Increasing leverage increases risk. Spot Gold and Silver contracts are not subject to regulation under the U.S. Commodity Exchange Act. Contracts for Difference (CFDs) are not available for US residents. Before deciding to trade forex, commodity futures, or digital assets, you should carefully consider your financial objectives, level of experience and risk appetite. Any opinions, news, research, analyses, prices or other information contained herein is intended as general information about the subject matter covered and is provided with the understanding that we do not provide any investment, legal, or tax advice. You should consult with appropriate counsel or other advisors on all investment, legal, or tax matters. References to FOREX.com or GAIN Capital refer to StoneX Group Inc. and its subsidiaries. Please read Characteristics and Risks of Standardized Options.