



Bitcoin Bulls Eye Weekend Bounce as Nasdaq Finds Support
Bitcoin bulls eye a weekend bounce as Nasdaq finds support, BTC holds $80k and bullish reversal signals emerge alongside stronger correlations.
Share this:

The US dollar and yields continued to retrace from their cycle highs despite the hot US inflation report, thanks to dovish Fed comments which have cooled bets of an October rate hike. This still leaves December as the likely timing for the next move, but that pushback in expectations has been enough to help Wall Street stabilise and hint at a bounce.
Given that the correlation between the Nasdaq and crypto has increased significantly over the past week, it puts us on guard for a potential bitcoin (BTC) bounce heading into the weekend.
View related analysis:
Bitcoin (BTC/USD) Eyes Rebound as Nasdaq and S&P 500 Stabilise
Bitcoin Correlations With Nasdaq and Tech Stocks Rebound
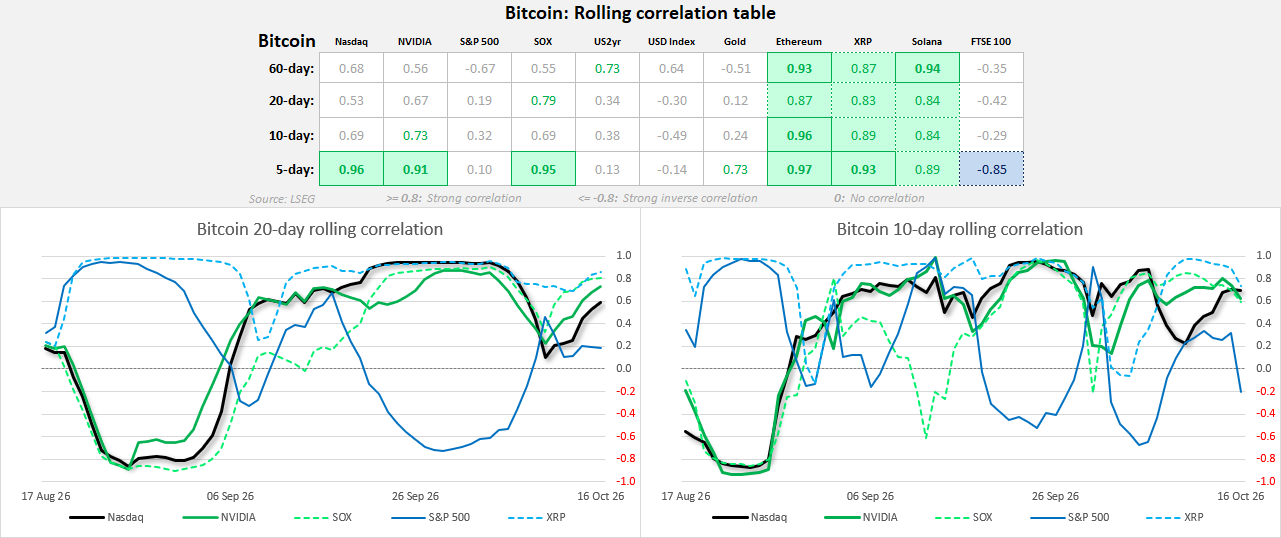
- While correlations between bitcoin and the technology sector have weakened in recent weeks, they appear to be making a comeback.
- The 5-day correlations between bitcoin and the Nasdaq, Nvidia and Philadelphia Semiconductor Index (SOX) have rebounded, with all now above 0.9.
- If sustained, this should see the 10- and 20-day correlations rise from current levels.
- Note that the strong correlations between BTC and Ethereum, XRP and Solana remain intact.

Nasdaq 100 Futures (MQ), Bitcoin Futures (BTC) Positioning | COT Report
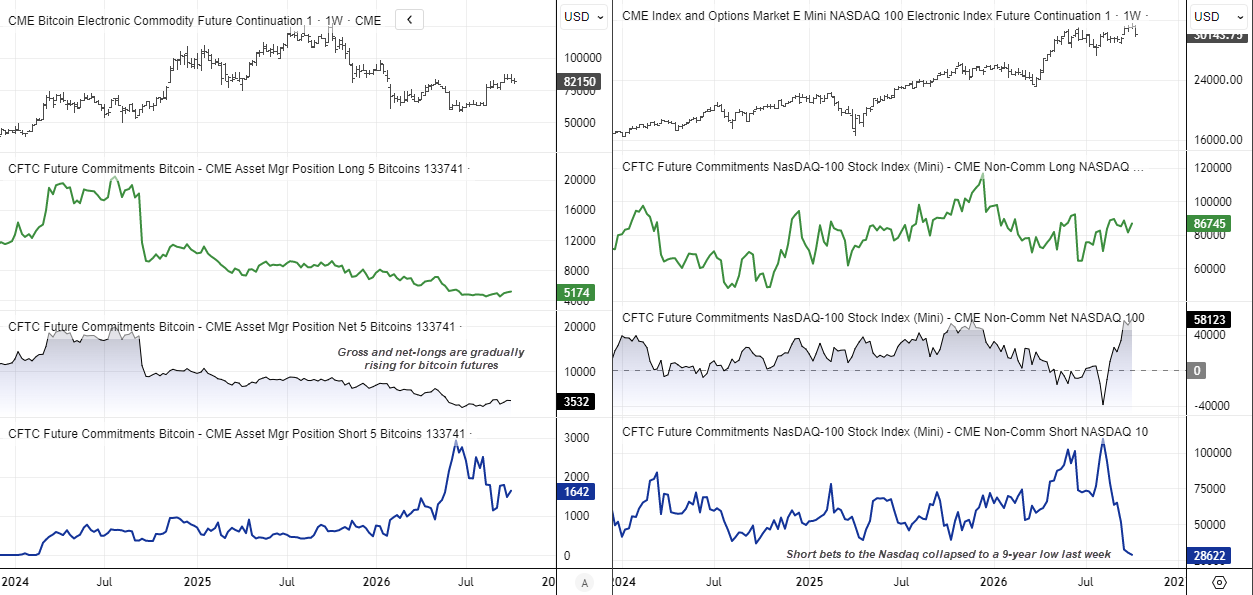
The weekly chart shows both the Nasdaq and bitcoin are in uptrends, though both have also retreated from their cycle highs. The Nasdaq has seen the more notable retracement so far, as it has been more sensitive to hawkish Fed bets and concerns over a frothy AI market. However, that does not mean we should expect a deep pullback, particularly when taking CME futures positioning into consideration from the weekly Commitments of Traders (COT) report.
Short bets from large speculators have collapsed, falling to a nine-year low of 28.6k contracts by last Tuesday. While they likely increased this week, I doubt they have fully recovered to their previous highs above 100k. Traders therefore likely remain net-long, and the daily chart also provides clues of a potential bounce over the near term.
Meanwhile, large speculators are also gradually increasing long bets on bitcoin futures, which is gently pushing net-long exposure higher, while short positions stood at roughly a third of long positions in the latest report.
Wall Street Outlook: S&P 500, Nasdaq 100 Daily Charts
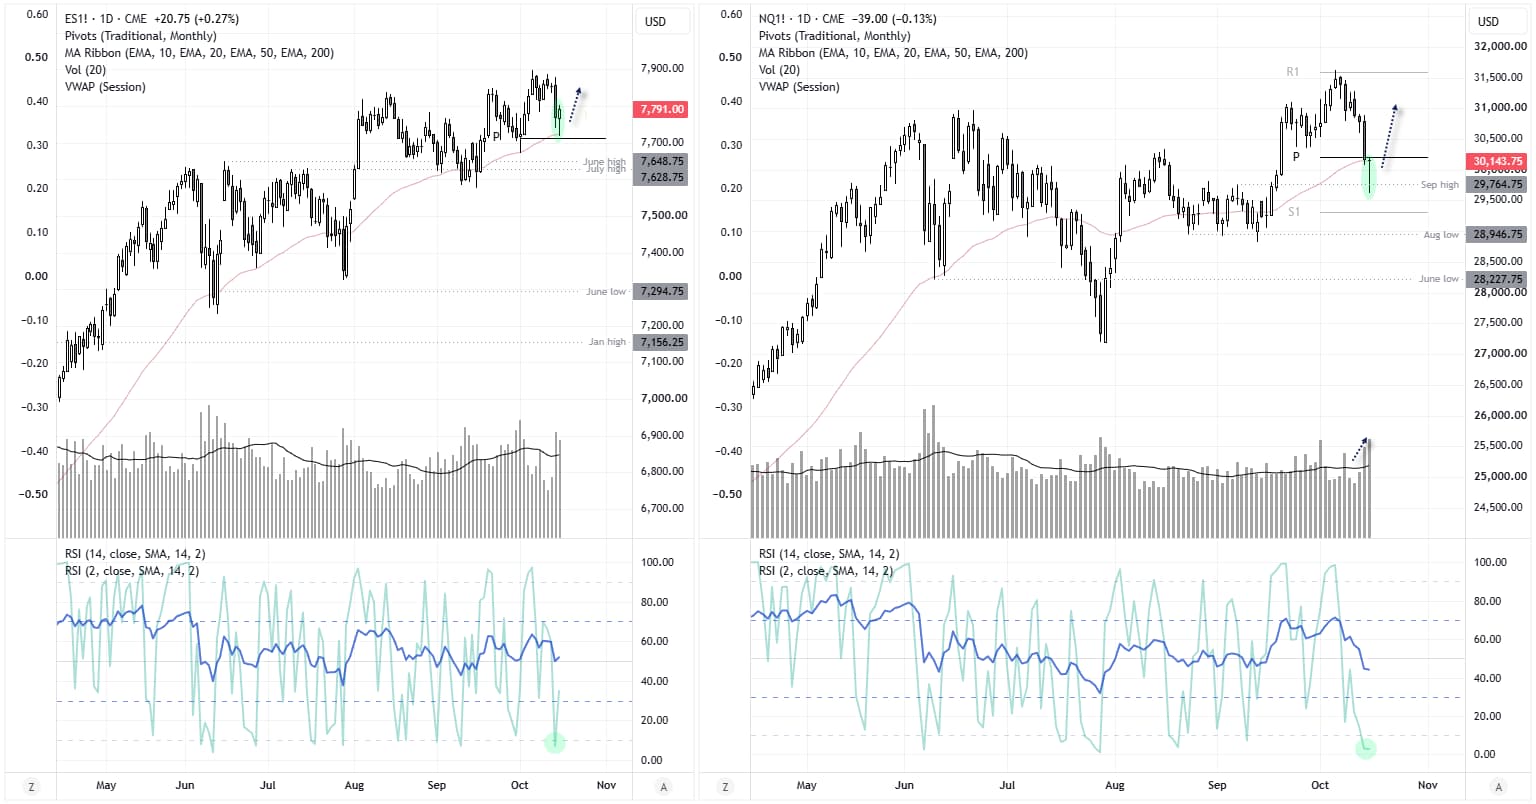
The dovish Fed comments helped the S&P and Nasdaq find stability on Thursday, bringing hope of a bounce into next week. A bullish hammer formed on the S&P daily chart, and its daily low respected the monthly pivot point and 50-dayu EMAS as support. Trading volumes on Thursday were also above average and nearly on par with the prior day’s selloff, which hints at a ‘change in hands’ from bears to bulls above support.
The Nasdaq actually broken beneath its monthly pivot point and 50-day EMA, though Thursday’s initial losses were fully recouped. Note the false intraday break of the September high, oversold daily RSI (2) and strongest daily volume since July 29 – which incidentally arrived the prior to the July swing low.
Source: CME, TradingView
Bitcoin (BTC/USD) Technical Outlook: Bitcoin vs US Dollar
Given the revival of the Nasdaq-bitcoin correlation, and bitcoin's tendency not to miss out when sentiment is buoyant, a Nasdaq bounce could also lift BTC.
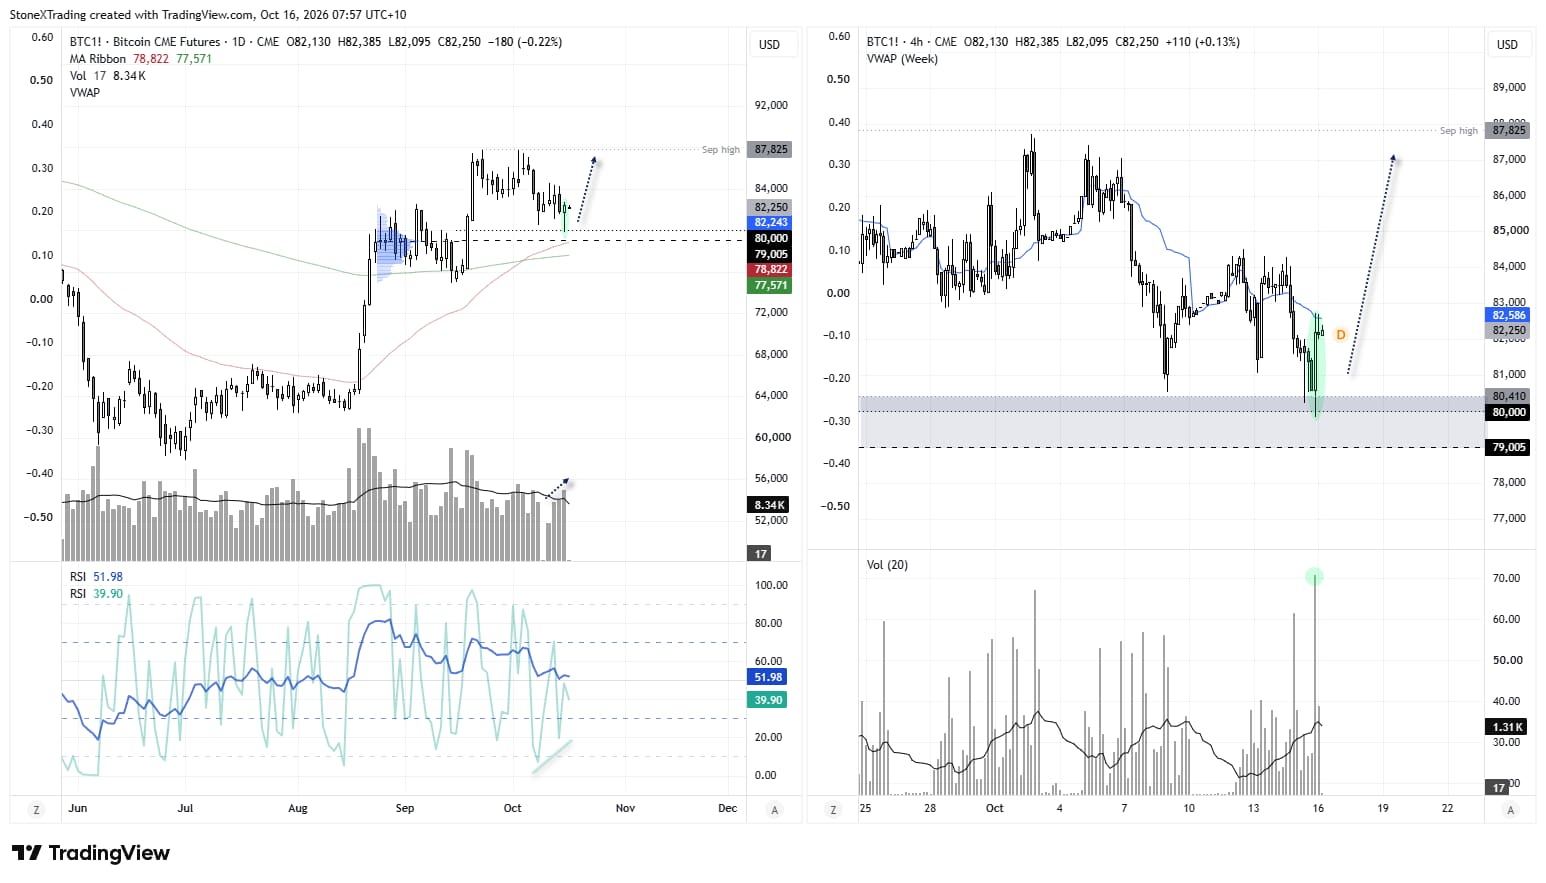
The daily chart shows a bullish hammer formed on above-average volume on Thursday, having found support almost perfectly at 80k. Note that the high-volume node at 79k sits near the 50-day EMA, with the 200-day EMA at 77,572 providing additional support, should it be required.
A bullish divergence formed on the daily RSI (2), while a prominent bullish engulfing candle – also on high volume – can be seen on the 4-hour chart.
Bulls could seek dips within Thursday's range in anticipation of a bounce towards the September highs, a break above which brings 90k into focus.
Source: CME, TradingView

Open an account in minutes
Experience award-winning platforms with fast and secure execution.
Economic calendar
Web Trader platform
Our sophisticated web-based platform is packed with features.
Related articles

Bond yields and crude call the shots for ASX 200
The ASX 200 has rallied on 93% of occasions this year when Australian three-year bond yields have fallen at least five basis points. With crude prices also plunging, the latest breakout has history on its side.


Gold coils for potential breakout as US CPI looms
Gold's ascending triangle is putting $4,140 firmly in focus ahead of US CPI. With traditional macro relationships offering few clues, the price action may prove more useful for traders.

USD/CAD Outlook: Loonie left behind as US CPI looms
USD/CAD's sharp rebound has coincided with widening US–Canada interest rate differentials. With US CPI approaching and bullish momentum building, another breakout may be on the cards.
The information on this web site is not targeted at the general public of any particular country. It is not intended for distribution to residents in any country where such distribution or use would contravene any local law or regulatory requirement. The information and opinions in this report are for general information use only and are not intended as an offer or solicitation with respect to the purchase or sale of any currency or CFD contract. All opinions and information contained in this report are subject to change without notice. This report has been prepared without regard to the specific investment objectives, financial situation and needs of any particular recipient. Any references to historical price movements or levels is informational based on our analysis and we do not represent or warranty that any such movements or levels are likely to reoccur in the future. While the information contained herein was obtained from sources believed to be reliable, author does not guarantee its accuracy or completeness, nor does author assume any liability for any direct, indirect or consequential loss that may result from the reliance by any person upon any such information or opinions.
Futures, Options on Futures, Foreign Exchange and other leveraged products involves significant risk of loss and is not suitable for all investors. Losses can exceed your deposits. Increasing leverage increases risk. Spot Gold and Silver contracts are not subject to regulation under the U.S. Commodity Exchange Act. Contracts for Difference (CFDs) are not available for US residents. Before deciding to trade forex, commodity futures, or digital assets, you should carefully consider your financial objectives, level of experience and risk appetite. Any opinions, news, research, analyses, prices or other information contained herein is intended as general information about the subject matter covered and is provided with the understanding that we do not provide any investment, legal, or tax advice. You should consult with appropriate counsel or other advisors on all investment, legal, or tax matters. References to FOREX.com or GAIN Capital refer to StoneX Group Inc. and its subsidiaries. Please read Characteristics and Risks of Standardized Options.