



Bitcoin, Ethereum Near Downtrend Tests as Risk Appetite Surges
A clean break higher would begin to shift longer-term directional risks, but failure at these levels risks reinforcing the broader bear trend.
Share this:

- Crypto rally runs into October downtrends
- BTC nears $73.5k–$74.5k resistance, ETH presses trendline
- Break shifts bias, rejection revives downside
Crypto Tracks Risk Rally into Key Tests
Despite maintaining a strong positive relationship with other riskier asset classes and equally strong inverse relationship with volatility measures such as the VIX, crypto has been one of the few asset classes spared over the past six weeks, trading higher than when the Iran war began in late February. That may be due to the fact both bitcoin and Ethereum had been pulverised in the preceding period, but at least the true believers can point to it as justification in holding crypto assets as a diversifier of performance.
While the asset class has held firm as others have wilted, what’s noticeable about both BTC/USD and ETH/USD is how strong their relationships have been with US stock futures and other markets in the outer extremities of the risk asset spectrum over the past week, meaning they too have been caught up in the euphoria surrounding the latest ceasefire deadline extension agreed between the US and Iran late Tuesday, pushing sharply higher in the hours since. The move has taken both tokens to within touching distance of key downtrends running from the record highs set in October last year, leaving the price action over the coming days potentially important when it comes to broader directional risks.
Bitcoin Nears Strong Resistance Zone
Source: TradingView
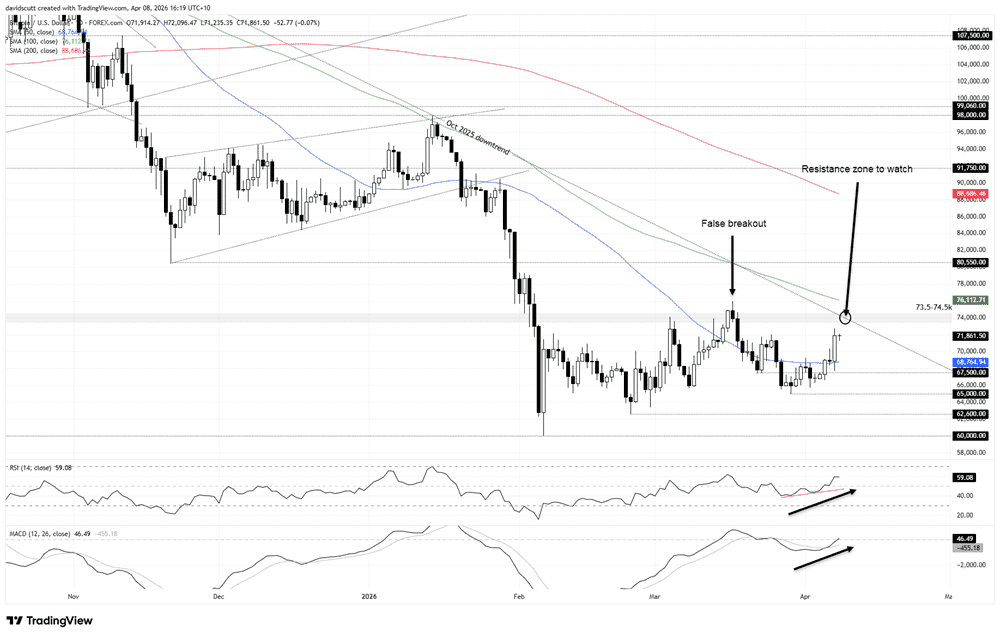
While BTC/USD is not yet threatening any form of major breakout, the latest push beyond the 50DMA has seen the price close in on a key resistance zone comprising overhead resistance between $73,500 to $74,500 and the downtrend running from the record highs. With a string of higher lows under the belt, and signals from the oscillators becoming increasingly bullish, with RSI (14) trending higher above 50 and MACD confirming the message by flipping positive after crossing the signal line from below, a test of this important zone looks increasingly likely over the coming days.
For now, BTC/USD has stalled around $72,000, which has capped previous bullish moves over the past month. It's the immediate reference point of note for traders, with the 50DMA next on the downside and the resistance zone on the topside. If BTC/USD were to break and close above the resistance zone, differentiating from the outcome seen in March where a breakout attempt above horizontal resistance fizzled, it would begin to shift directional risks, breaking the broader bearish structure. Such a move would open the door for a possible retest of the 100DMA and, beyond that, resistance at $80,550, coinciding with the low set in November last year.
If the latest bounce reverses back beneath the 50DMA, it would reinforce the long-running bearish bias, putting levels such as $67,500, $65,000, $62,600 and $60,000 in play for shorts.
Ethereum: $2,200 Break Puts Trendline in Play
Source: TradingView
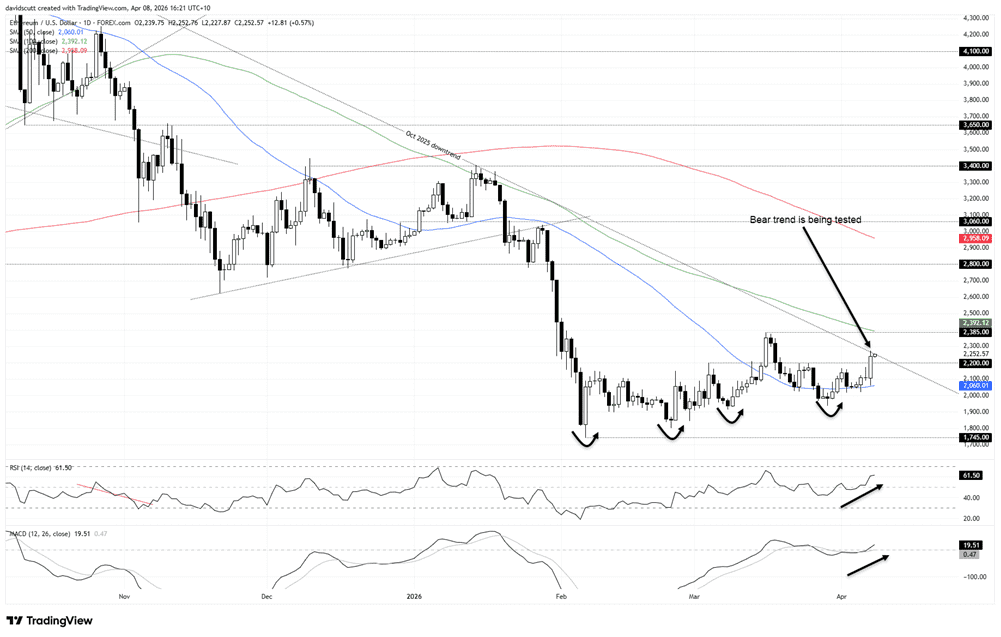
While BTC/USD is not yet threatening the October downtrend, ETH/USD finds itself wedged right against it following the break above $2,200 resistance, making the price action today all the more important. With the oscillators flipping bullish in terms of directional bias, if only marginally at this stage, conditions are improving for a possible breakout.
If that eventuates, the price action at the intersection of the March high at $2,385 and the 100DMA creates an early test for bulls, with a clean break above this zone likely to encourage additional buyers to join the move, opening the path for a test of $2,800 which has been an important pivot point for the price going back several years.
If the downtrend holds, immediate downside levels of note include $2,200 which may now flip to offering support, with the 50DMA the next level after that. If the latter were to be broken, bears would likely eye a retest of the February low of $1,745.
Related tags:


Open an account in minutes
Experience award-winning platforms with fast and secure execution.
Economic calendar
Web Trader platform
Our sophisticated web-based platform is packed with features.
Related articles
Australian Dollar Forecast: AUD/USD Breaks Multi-Month Range, Hits 10-Month Low 11 14 2026
Aussie bears are closing in on major technical support, with next week's Australian employment data raising the stakes for a pivotal reaction.

USD/JPY Weekly Outlook: Bulls Eye Higher Range After Historic Rate Shock
A historic US rate shock has sent USD/JPY above 160, but with intervention risks rising and few major economic catalysts ahead, AI sentiment could hold the key to the next move.

Nvidia Earnings Preview: NVDA’s First Test of the Post Jenson Huang Era
Nvidia is expected to report $2.47 in EPS on $108.8B in revenue this quarter, but investors will be more interested in the company's guidance after the unexpected departure of founder and CEO Jenson Huang.

The information on this web site is not targeted at the general public of any particular country. It is not intended for distribution to residents in any country where such distribution or use would contravene any local law or regulatory requirement. The information and opinions in this report are for general information use only and are not intended as an offer or solicitation with respect to the purchase or sale of any currency or CFD contract. All opinions and information contained in this report are subject to change without notice. This report has been prepared without regard to the specific investment objectives, financial situation and needs of any particular recipient. Any references to historical price movements or levels is informational based on our analysis and we do not represent or warranty that any such movements or levels are likely to reoccur in the future. While the information contained herein was obtained from sources believed to be reliable, author does not guarantee its accuracy or completeness, nor does author assume any liability for any direct, indirect or consequential loss that may result from the reliance by any person upon any such information or opinions.
Futures, Options on Futures, Foreign Exchange and other leveraged products involves significant risk of loss and is not suitable for all investors. Losses can exceed your deposits. Increasing leverage increases risk. Spot Gold and Silver contracts are not subject to regulation under the U.S. Commodity Exchange Act. Contracts for Difference (CFDs) are not available for US residents. Before deciding to trade forex, commodity futures, or digital assets, you should carefully consider your financial objectives, level of experience and risk appetite. Any opinions, news, research, analyses, prices or other information contained herein is intended as general information about the subject matter covered and is provided with the understanding that we do not provide any investment, legal, or tax advice. You should consult with appropriate counsel or other advisors on all investment, legal, or tax matters. References to FOREX.com or GAIN Capital refer to StoneX Group Inc. and its subsidiaries. Please read Characteristics and Risks of Standardized Options.