Bitcoin has posted a six-session losing streak, with prices down nearly 8% in the short term. In this context, selling pressure has started to consolidate as rising market uncertainty has led to a decline in risk appetite. As Bitcoin is currently viewed as a risk asset, it has absorbed part of this weakness, and as long as demand continues to show signs of fragility, the current selling pressure could become even more relevant over the coming sessions.

Demand begins to show signs of weakness
Growing market uncertainty, driven by escalating diplomatic and trade tensions between the United States and Europe, has created an unfavorable environment for risk assets. This shift has reduced appetite for higher-risk investments and has directly impacted the crypto market, where Bitcoin continues to be perceived as a risk asset. As a result, part of the capital has rotated toward more stable assets, limiting short-term demand for BTC.
Looking at Bitcoin’s market capitalization, it has fallen from levels close to $2 trillion, recorded on January 14, to around $1.78 trillion. This move reflects a significant capital outflow, explaining the sharp recent decline in BTC prices and the loss of billions of dollars across the crypto market in recent sessions.
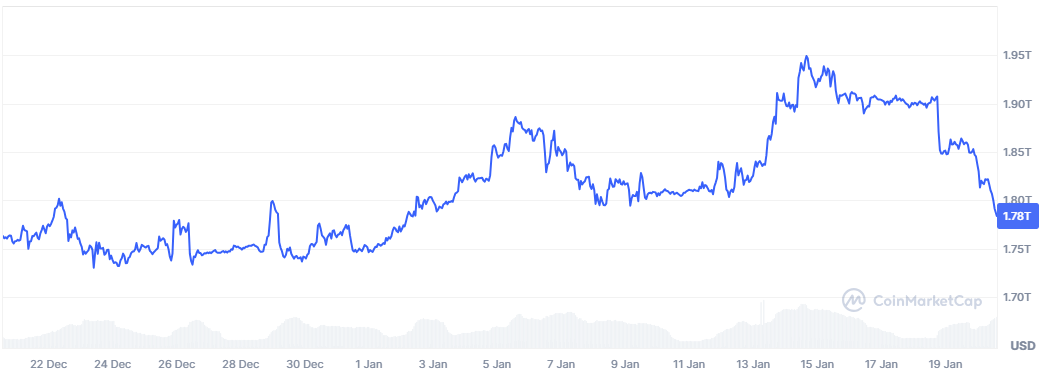
Source: Coinmarketcap
Meanwhile, the open interest indicator has rebounded toward the $29.8 billion area, coinciding with Bitcoin’s recent drop below $90,000 per BTC. It is important to note that open interest measures the total number of open long and short positions in the institutional market. In this case, rising open interest alongside falling prices suggests a notable increase in short positions, pointing to a decline in short-term confidence among institutional participants.
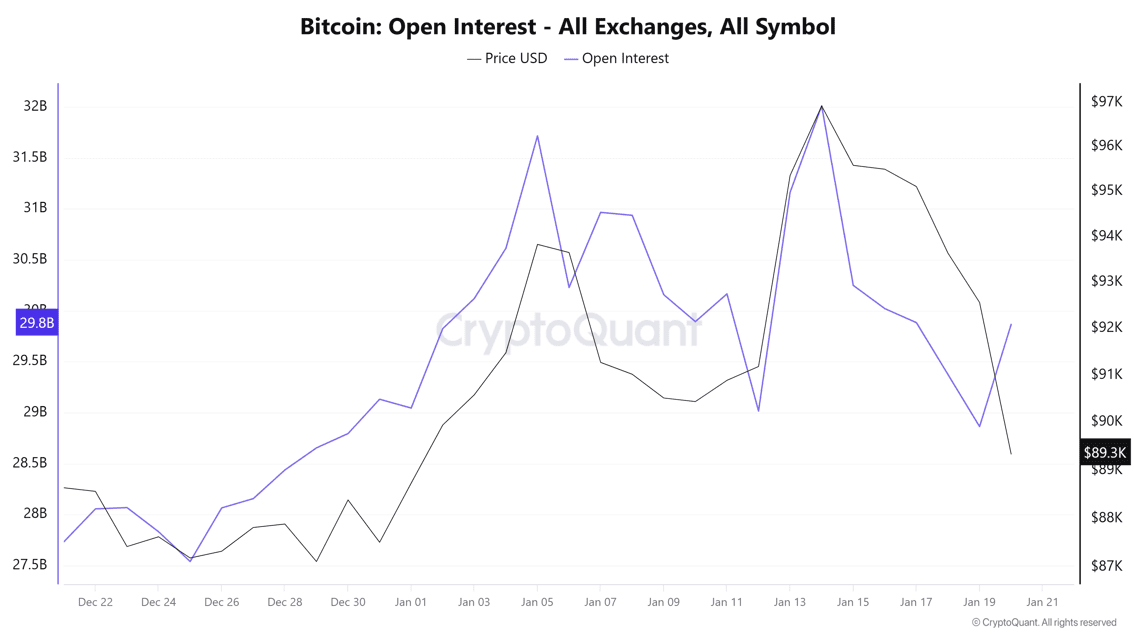
Source: Cryptoquant
Taken together, these developments suggest that a new phase of risk aversion is currently dominating markets, causing Bitcoin demand to lose ground in a meaningful way. As long as this risk-off environment persists, selling pressure is likely to remain present in the BTC market over additional sessions.
Market confidence continues to deteriorate
The Crypto Fear and Greed Index has shown a notable decline from the highs seen in recent weeks, when it stood near 54 points, and is now hovering around 42 points, close to the boundary between the neutral and fear zones. This move reflects a deterioration in perceived market stability within the crypto space in the short term.
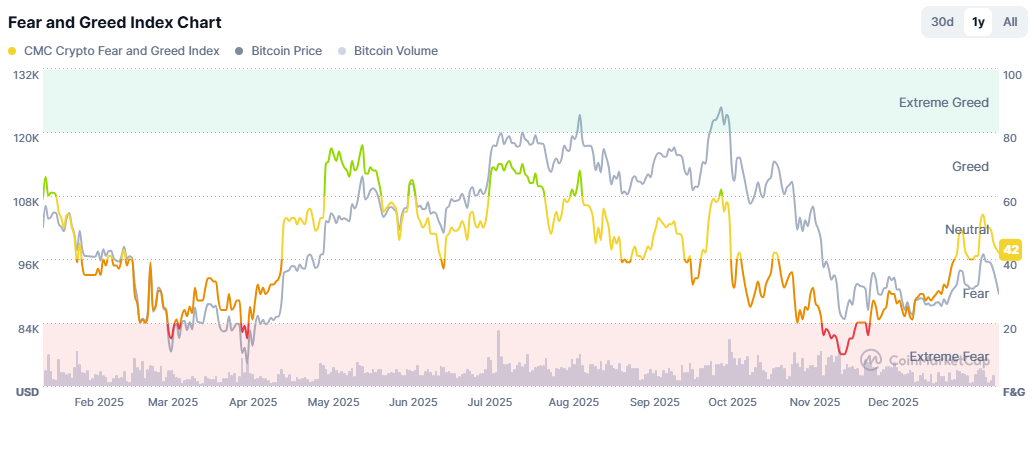
Source: Coinmarketcap
If confidence indicators continue to weaken, it will be difficult to sustain an environment that supports consistent demand for Bitcoin in the near term. This backdrop could maintain a structural bearish bias, acting as an additional catalyst for prolonged selling pressure in the coming sessions.
Bitcoin Technical Outlook
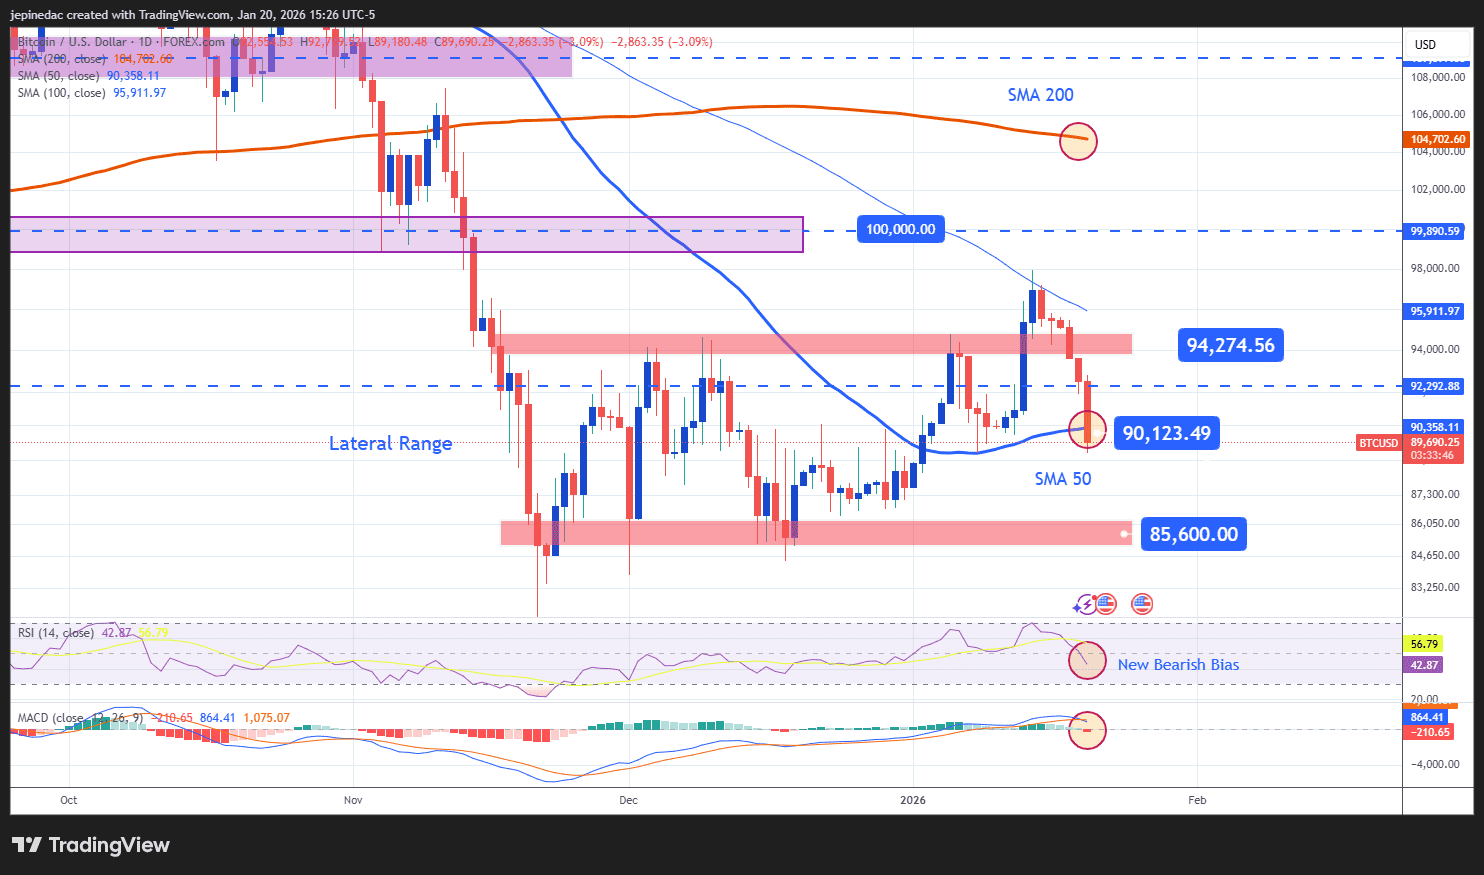
Source: StoneX, Tradingview
- The sideways range regains control: Despite several attempts to develop a bullish move in recent sessions, weakness has once again taken over and price has returned to a sideways range, capped near $94,200 and supported around $85,600 per BTC. So far, price action has been insufficient to break either boundary, keeping the range-bound structure as the dominant technical formation in the short term.
- RSI: The RSI has declined notably, moving below the neutral 50 level, suggesting that selling momentum has taken control of short-term price behavior. If the indicator continues to weaken, bearish pressure could remain in place over the coming sessions.
- MACD: A similar signal is visible in the MACD, whose histogram has crossed below the zero line, indicating that short-term moving averages are beginning to reflect consistent selling pressure. This reinforces the view of structural weakness in Bitcoin’s price.
Key levels:
- 94,274 USD – Key resistance: An area of recent highs that aligns with the upper boundary of the sideways range. A sustained break above this level would put the current structure at risk and could open the door to a new short-term bullish bias.
- 90,123 USD – Nearby barrier: A level aligned with the 50-period simple moving average. Failure to move decisively away from this zone could extend the dominance of the sideways range.
- 85,600 USD – Definitive support: An area corresponding to the lows of recent months and the most important downside level to monitor. A sustained break below this support could trigger a new dominant bearish leg, similar to what was observed in previous months.
Written by Julian Pineda, CFA, CMT – Market Analyst
Follow him on: @julianpineda25