Key Events
• Bitcoin is struggling to regain momentum above the 70,000 zone, keeping broader risk sentiment capped.
• Extreme bearish sentiment hints at potential contrarian moves and a possible accumulation phase, yet key technical levels remain critical in assessing dip-buying potential.
CNN Fear and Greed Index
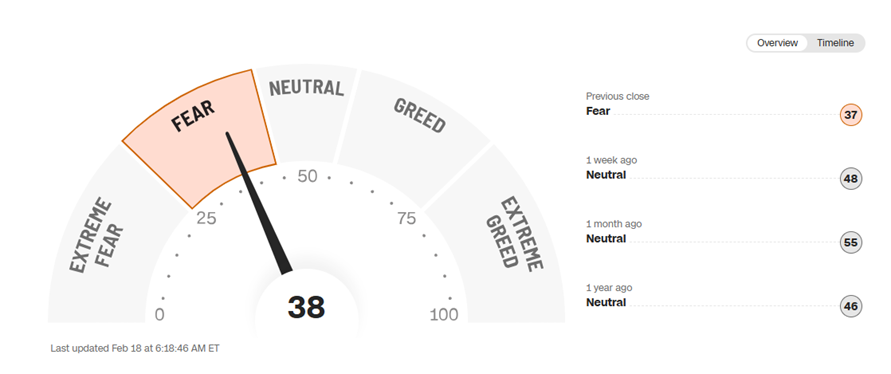
Source: CNN
With Bitcoin failing to reclaim 70,000, the Nasdaq unable to sustain levels above 25,000, and the Dow Jones holding below 50,000, risk sentiment is leaning increasingly cautious. This backdrop raises questions about whether further drawdowns are ahead or whether markets are approaching a contrarian reversal zone.
From a Bitcoin perspective, current momentum conditions are aligning with oversold levels last seen in 2022, suggesting the possibility of a near-term rebound. In contrast, US indices, particularly the Nasdaq, continue to reflect distribution risks, with five consecutive pullbacks recorded from the 26,000 threshold. Downside risks remain active should critical support levels fail.
This is where technical analysis becomes decisive, particularly ahead of potential catalysts such as improving sentiment, supportive crypto legislation, or clarity from FOMC minutes. Key levels will determine whether the current environment reflects short-term volatility or a structural shift in trend.
Technical Analysis: Quantifying Uncertainties
Bitcoin Outlook: Two Week Time Frame – Log Scale

Source: TradingView
From a two-week perspective, which filters out the noise of the weekly chart, the corrective cycle from the October 2025 highs near 126,000 appears to be stabilizing after reaching several technical milestones:
• The full projected target of the bearish wedge formation that developed between November 2024 and January 2026.
• Oversold RSI levels comparable to those seen in 2022, when Bitcoin traded near 15,000.
• Extended downside wicks reflecting rejection of sustained trade below the key 60,000 level.
This technical alignment improves the case for a bullish reversal. However, with sentiment still fragile, a decisive break below 60,000 could trigger one final drawdown toward the 50,000–48,000 zone, an area likely to attract strategic dip-buying interest.
On the upside, a sustained close above 75,000 followed by a reclaim of 80,000 would reassert bullish bias, exposing 100,000 and 110,000 before confirming the potential for another record rally toward 150,000 and possibly 200,000.
Bitcoin Outlook: Monthly Time Frame – Log Scale
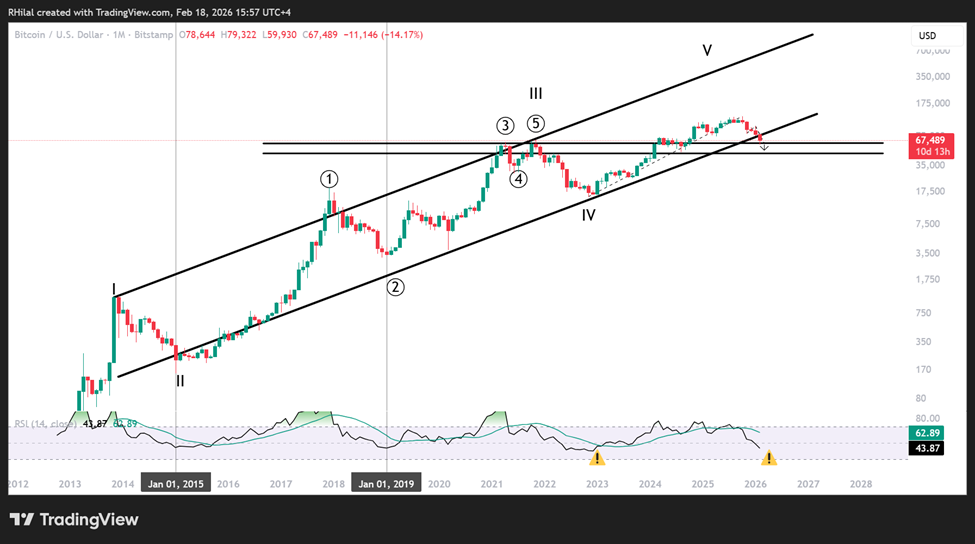
Source: TradingView
From a monthly and logarithmic perspective, Bitcoin’s price action is testing a potential bearish break below the bounds of the long-respected uptrend that has been in place since 2015. A sustained move below this structure would amplify downside pressure, particularly while price remains capped below the 80,000 threshold.
However, this same structure also reinforces the integrity of the long-term bull trend. A recovery back above 80,000, followed by a sustained move beyond 100,000, would reassert the broader bullish cycle and confirm that the current weakness remains corrective rather than structural.
Written by Razan Hilal, CMT
Follow on X: @Rh_waves