



It was a couple of weeks ago that I looked at the possibility of outperformance in the British Pound after the currency lagged behind the Euro over the prior three weeks. The key observation was that EUR/USD was holding higher-lows through March while GBP/USD was grinding down to lower-lows, although sellers weren’t making much significant headway. That allowed for a falling wedge formation to build in GBP/USD, which started to break out a few weeks ago as the USD broke down on ceasefire reports, and that’s created a fresh bullish trend in GBP/USD that remains in place today.
I looked into this in the webinar last week, as the currency pair had already begun to engage with a key spot of resistance at 1.3568. And you can’t blame bulls for not trying, as they attempted to breakout for four consecutive days to finish last week and notably, both Thursday and Friday led to higher-highs even if buyers weren’t able to extend the move.
But now – price has pulled back to the support zone looked at last week, running from prior resistance of 1.3484 up to the 1.3500 psychological level – and that support has so far held as the daily bar has put in a bounce.
As of this writing there’s still a lot of time for that daily bar to complete but if it were to close now, it would take on the appearance of a hammer with a long underside wick and a full body sitting atop that wick. This is indicative of bulls responding to support and re-taking control of price, which keeps the door open for a re-test of that 1.3568 resistance and perhaps even the resistance level above that at 1.3623.
GBP/USD Daily Price Chart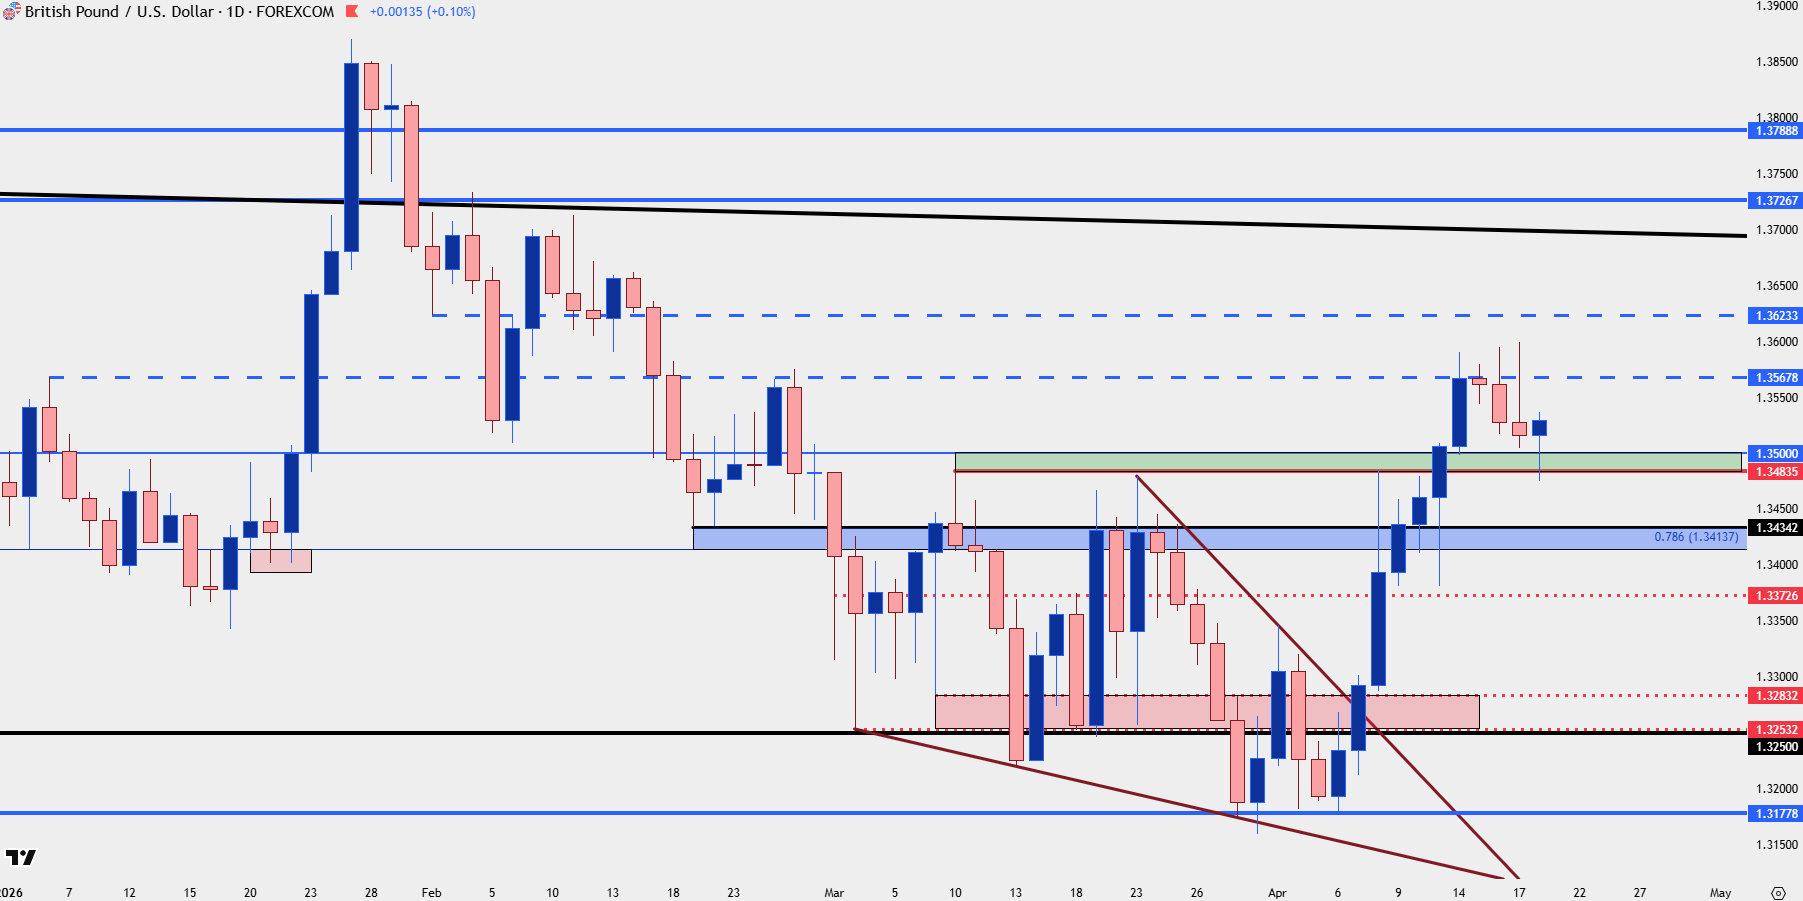
Chart prepared by James Stanley; data derived from Tradingview
GBP/USD Shorter-Term
From the four-hour chart we can see that support defense and from a price action perspective this held well with two tests at the bottom of the zone, with the second showing as a higher-low before buyers were able to make a push.
Overhead, however, there’s a clear line in the sand that bulls will need to deal with in continuation scenarios, and that’s right around the 1.3590-1.3600 area, with the latter price level holding the high on Friday right at the psychological level (when rounded up).
That’s the spot for buyers to beat to continue the trend at this point.
GBP/USD Four-Hour Chart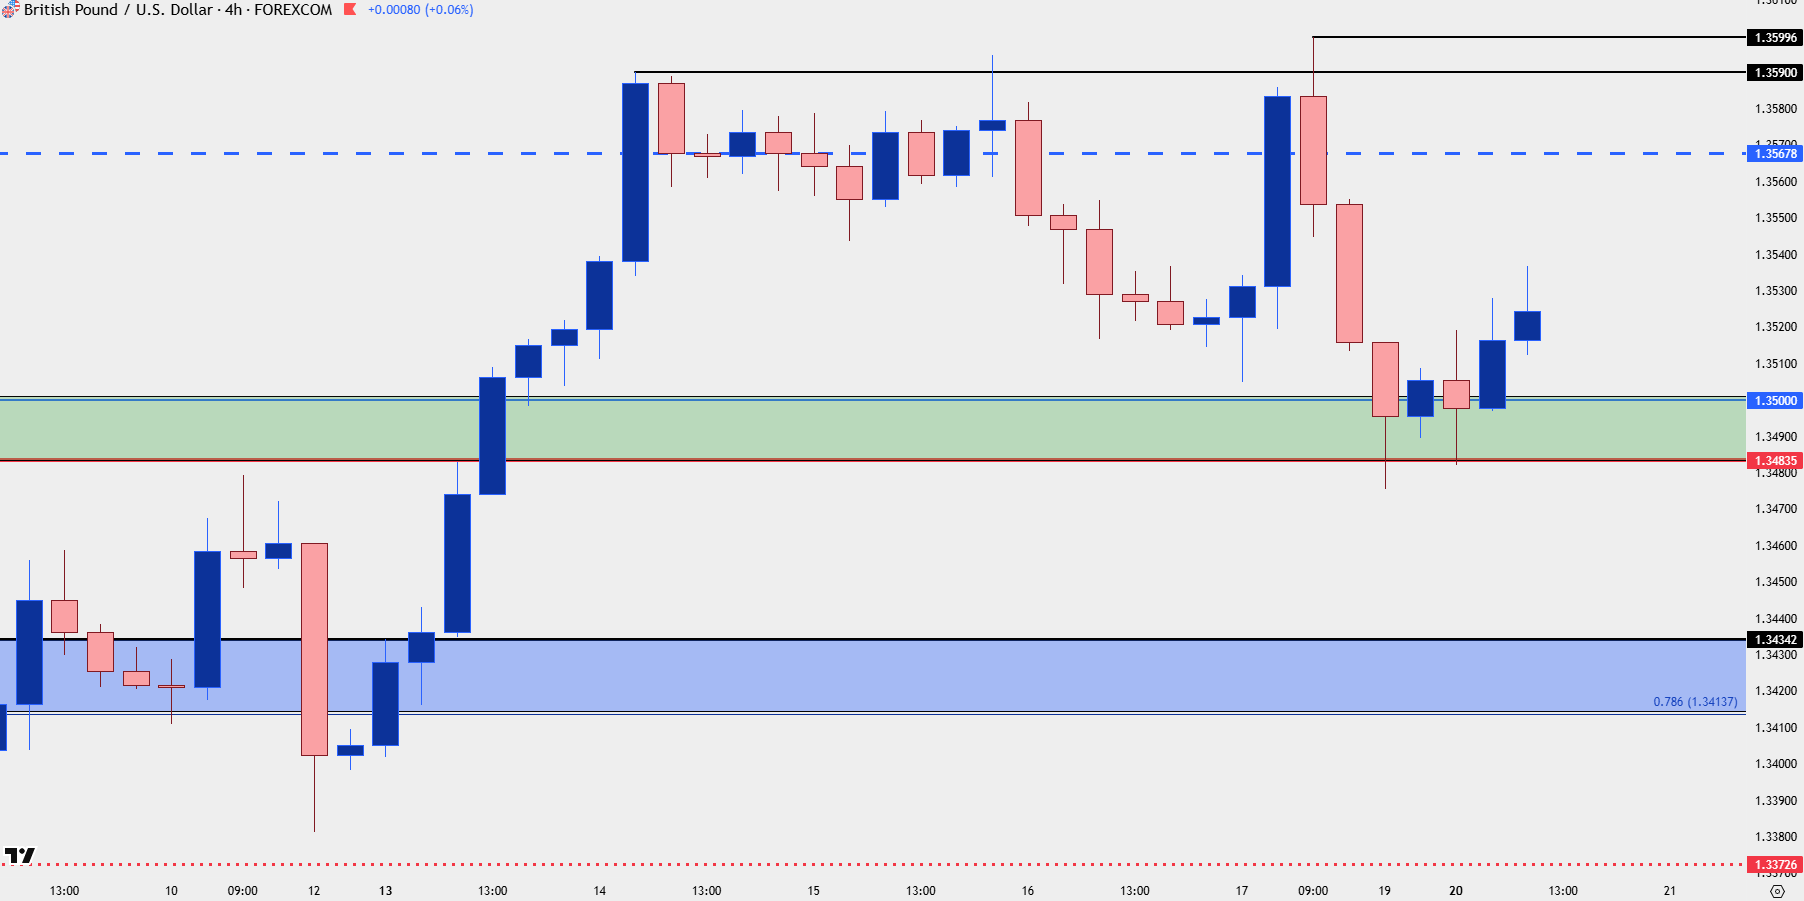
Chart prepared by James Stanley; data derived from Tradingview
GBP/JPY
While Cable has been a bit more restrained so far in 2026 trade as taken from that gyration in the USD backdrop, the Japanese Yen has continued to sell-off in brisk fashion and in GBP/JPY, this led to a massive rally in early-April as the pair gained more than 500 pips, trough-to-peak.
But last week saw a key resistance level come into play and there’s some historical reference there, as this was the lower-high back in 2009 before the pair really sold off fast.
After taking a couple months for bulls to finally gain acceptance at 210 and run up for a test of 215, it’s that swing-high from 17 years ago that has so far stalled the move.
GBP/JPY Monthly Price Chart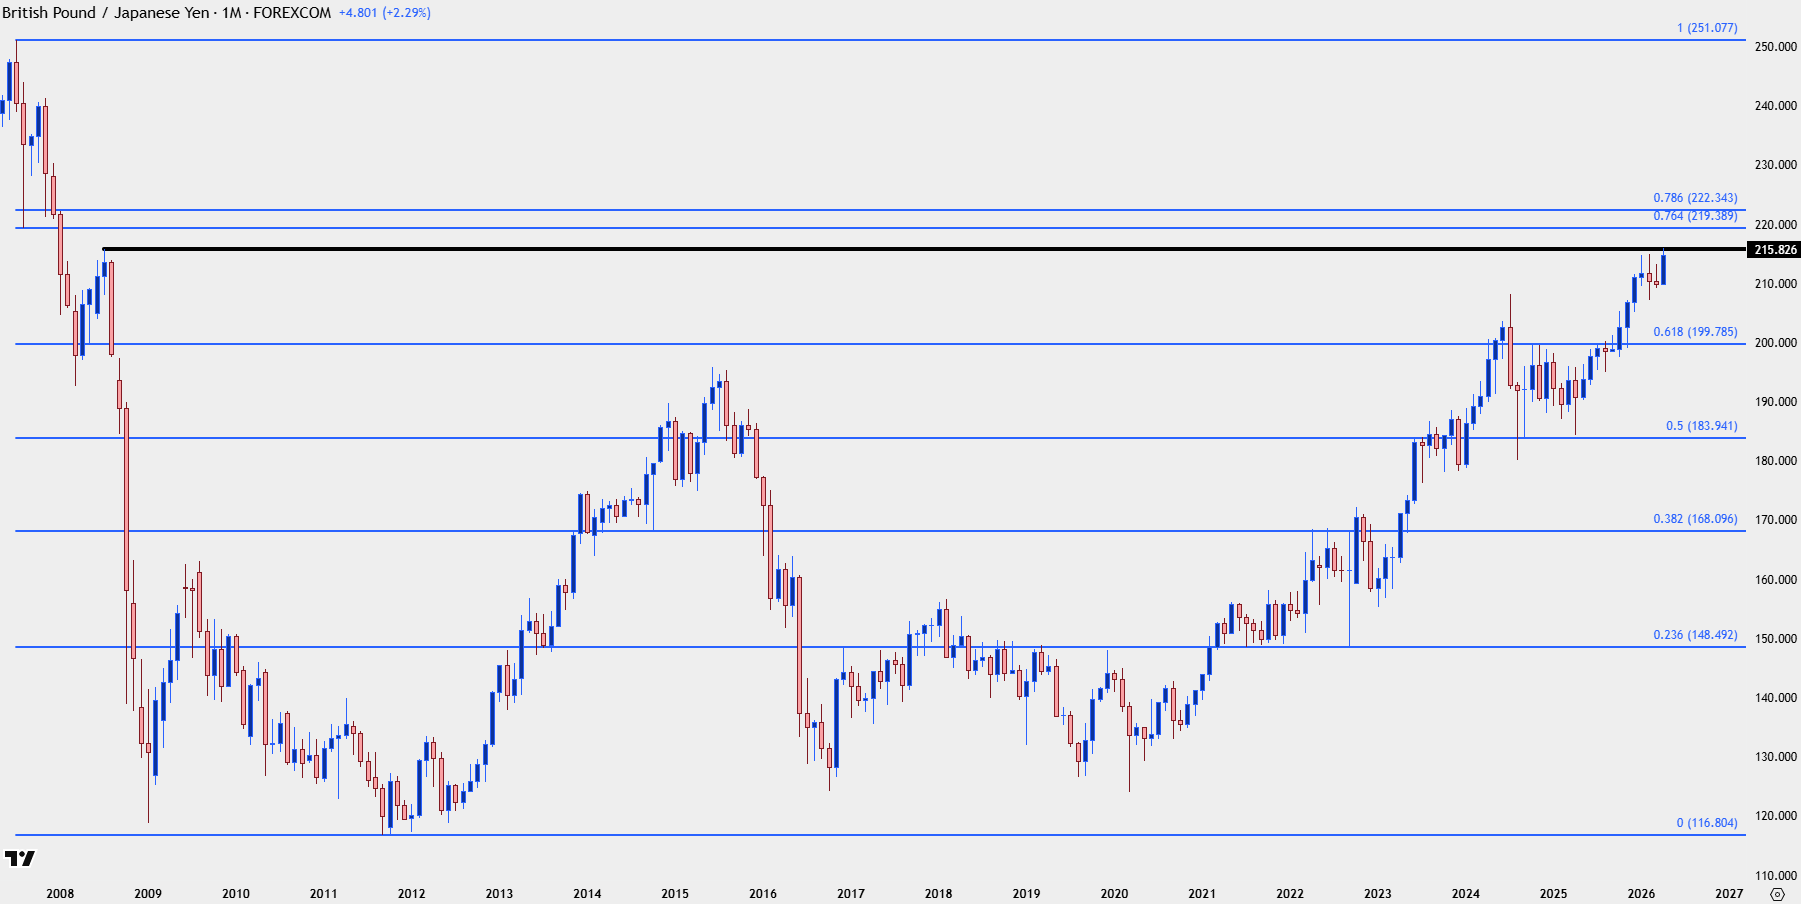
Chart prepared by James Stanley; data derived from Tradingview
GBP/JPY Shorter-Term
Back in January and February, it was the 215 level that buyers seemed cautious of. We had three spikes with the first two falling just short of the round level as the third touched it perfectly before snapping back.
And that snap back ran for a while, as prices pushed all the way down for a test below 207.50. Since then, however, it’s been a steady build of higher-lows and higher-highs, with a spark in early-April following a quick test below the 210.00 level. That rally has since pushed all the way up to the 215.83 price that was shown above, and that’s so far held bulls at bay.
At this point, it’s the prior resistance at 214.30 that’s come back into the picture to hold the lows, and buyers have an open door to make a run. If this support doesn’t hold, however, there’s a deeper spot of support a little lower, a prior point of resistance that held twice in March, plotted at 213.31.
GBP/JPY Daily Chart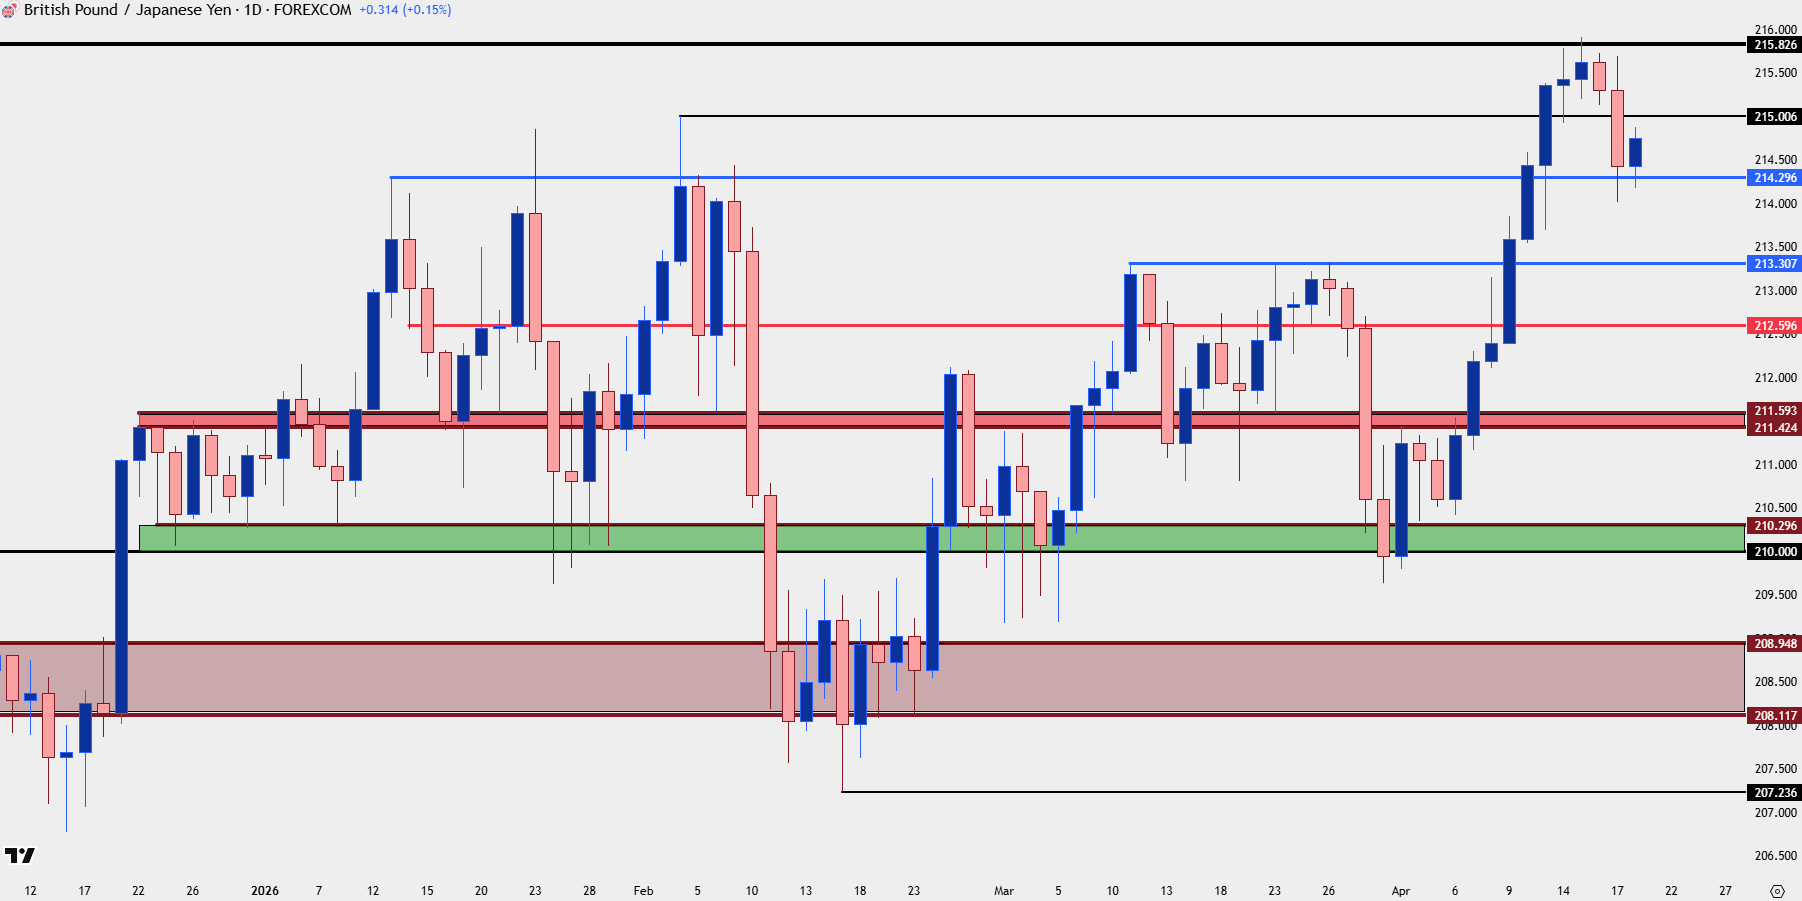
Chart prepared by James Stanley; data derived from Tradingview
EUR/GBP
As we came into April EUR/GBP was pressing up against a familiar spot of resistance, and while the cross pair often shows mean reverting tendencies, the discrepancy can be spanned into majors pairs, or Yen pairs, for strategy in those markets. As followed up in the weeks since, GBP/USD had outpaced EUR/USD and GBP/JPY had outpaced EUR/JPY, helped along by that greater GBP strength that’s evident in the past two weekly bars in the cross pair.
At this point, there’s an important line in the sand at 0.8679, and if that gets crossed, the door opens for a re-test of range support around 0.8628.
EURGBP Daily Chart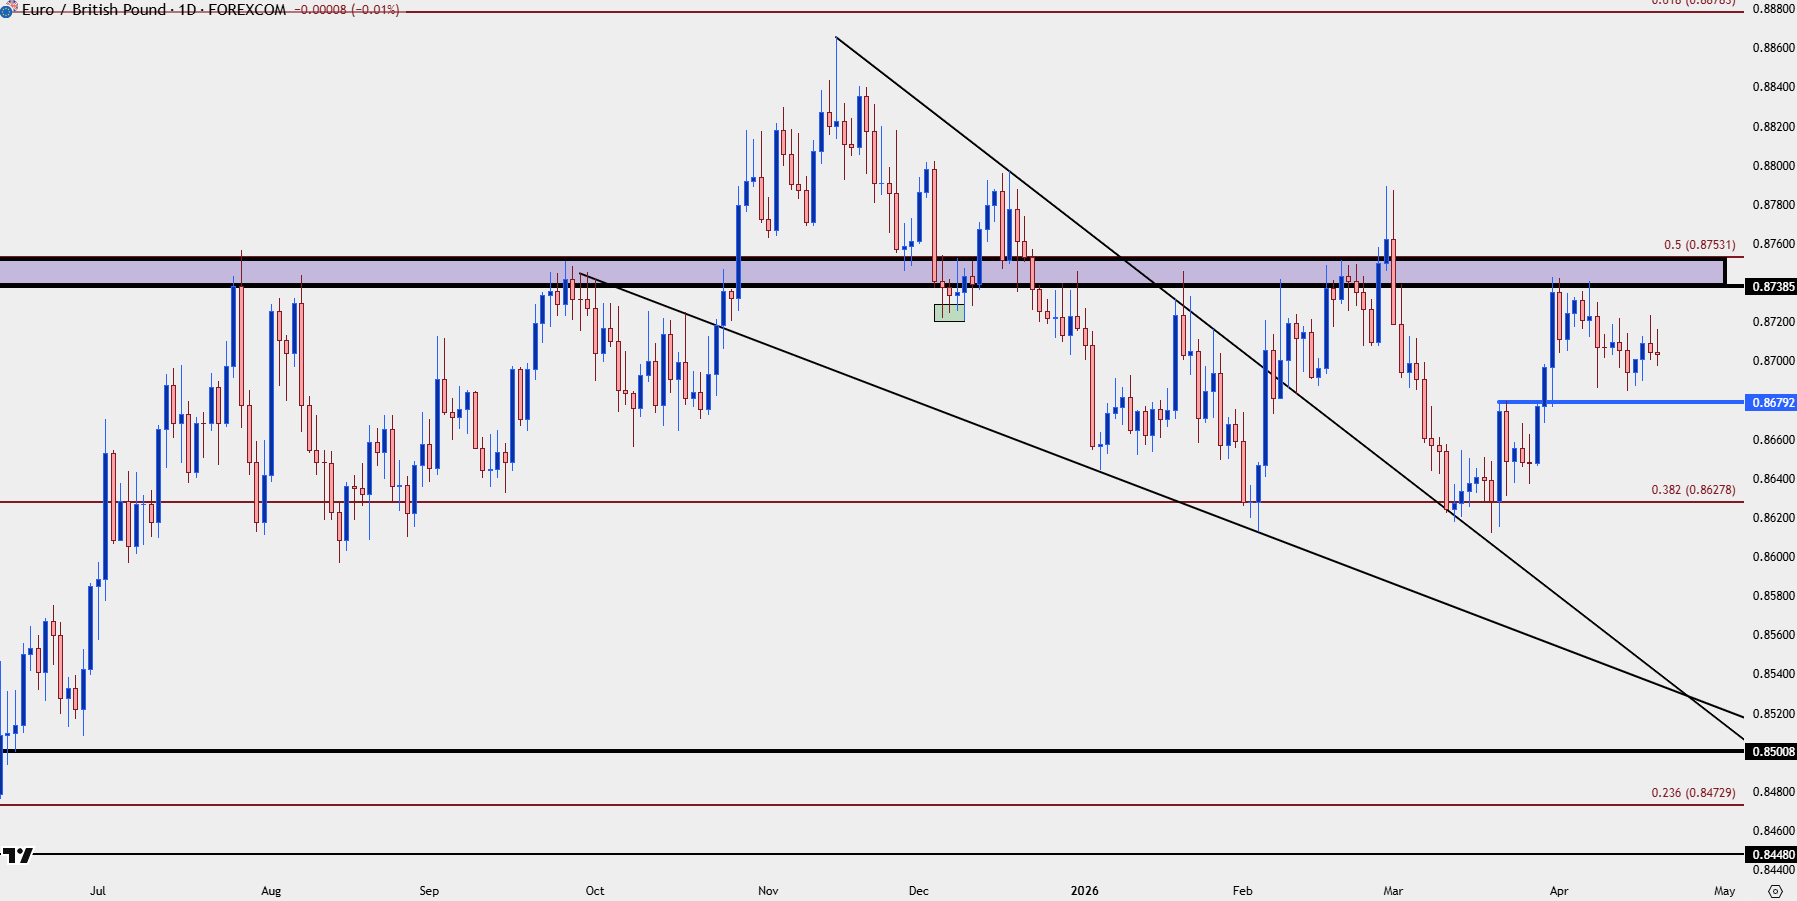
Chart prepared by James Stanley; data derived from Tradingview
--- written by James Stanley, Senior Market Analyst, Global Macro






