


The USD/CAD pair has now posted five consecutive bullish sessions in the short term, registering a gain of just over 1% during that period, with price action favoring the U.S. dollar. Buying pressure has remained consistent in recent sessions, particularly following the release of Canada’s CPI data, which may alter central bank expectations. This has been accompanied by renewed short-term strength in the U.S. dollar.
If these dynamics persist, they could continue to support stronger buying pressure in the pair over the coming trading sessions.

Inflation Data Released
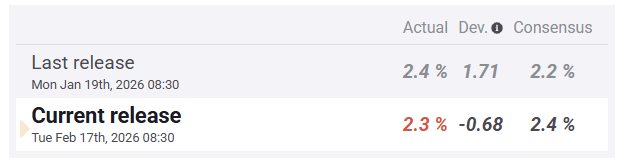
Earlier today, Canada’s year-over-year (YoY) CPI data were published. While the annual rate was expected at 2.4%, the actual figure came in slightly lower at 2.3%, suggesting inflation is stabilizing better than market expectations.
Source: FXSTREET
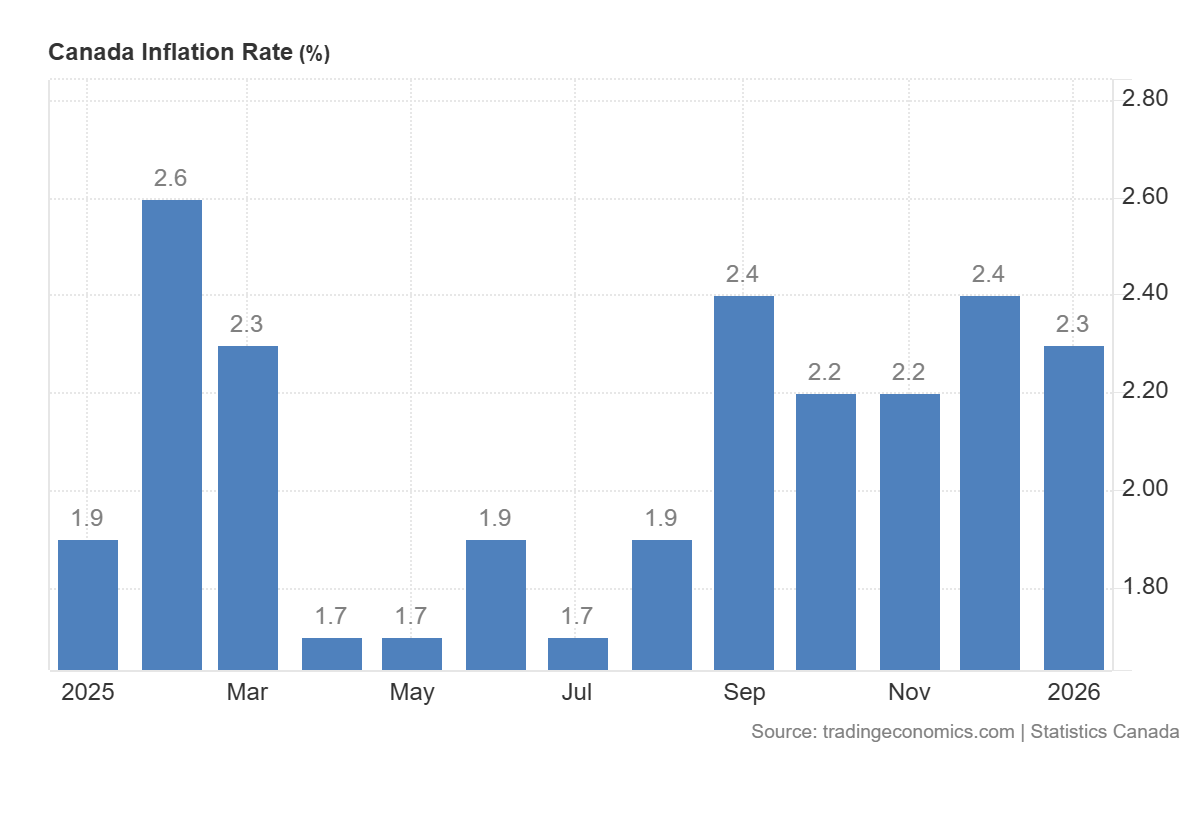
A key takeaway is the renewed slowdown in inflation, with the rate returning to the 2.3% area and moving closer to the Bank of Canada’s 2.00% target. Recent inflation readings show a more neutral trajectory and do not reflect sustained upward pressure in consumer prices, thereby reducing the risk of inflation getting out of control in the short term.
Source: TradingEconomics
In previous meetings, the Bank of Canada emphasized a “wait-and-see” approach in managing monetary policy, closely monitoring indicators that could generate renewed inflationary pressures. The latest data, showing continued moderation in inflation, may support maintaining the policy rate at 2.25%, significantly below the 3.75% rate currently in place in the United States.
This interest rate differential remains a key factor. As long as the Bank of Canada does not adopt a more aggressive stance to narrow the gap with the U.S., the relative attractiveness of U.S. dollar-denominated assets may continue to exceed that of Canadian dollar assets. In this context, the recent inflation data—by reducing the likelihood of restrictive adjustments in Canada—could limit CAD attractiveness and favor further recovery in the U.S. dollar in the short term, thereby sustaining buying pressure in USD/CAD.
U.S. Dollar Recovery
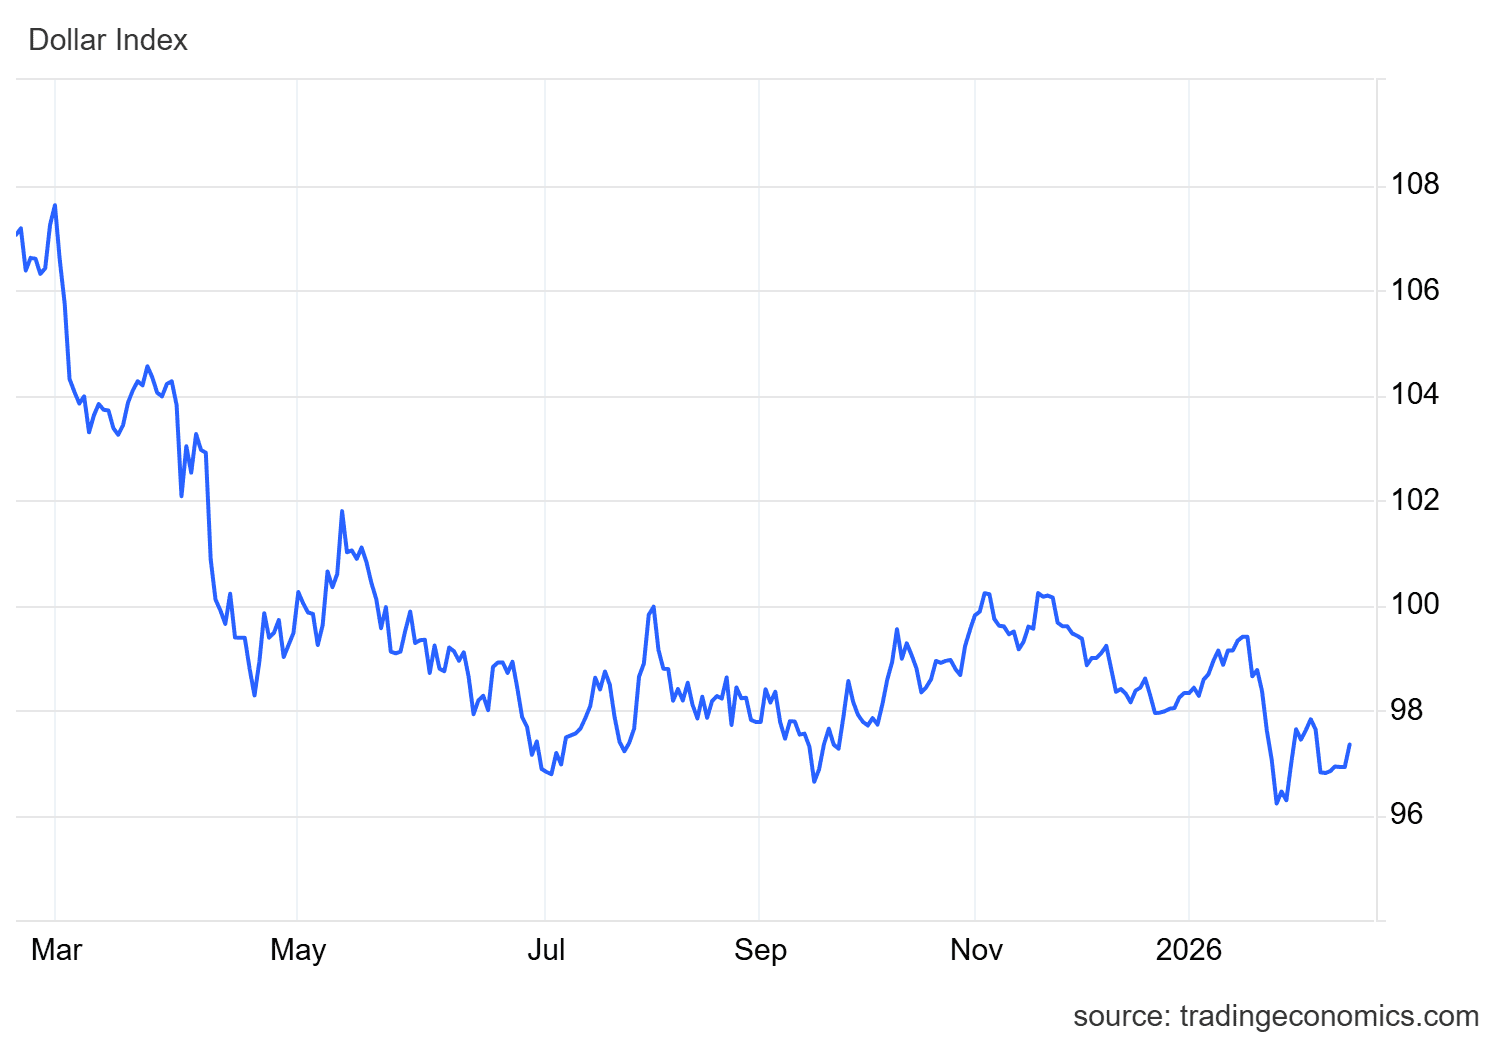
Beyond domestic Canadian factors, it is also important to consider the recent performance of the U.S. dollar. The DXY index, which measures the dollar’s strength against major peers, has shown a rebound above the 97-point area, correcting part of the downside move observed toward late January 2025.
Source: TradingEconomics
A more consistent recovery in the DXY, particularly if it approaches the psychological 100-point level, could reflect renewed demand for the U.S. dollar. If this trend consolidates, the Canadian dollar may continue to weaken, supporting additional buying pressure in USD/CAD in the short term.
USD/CAD Technical Outlook
Source: StoneX, Tradingview
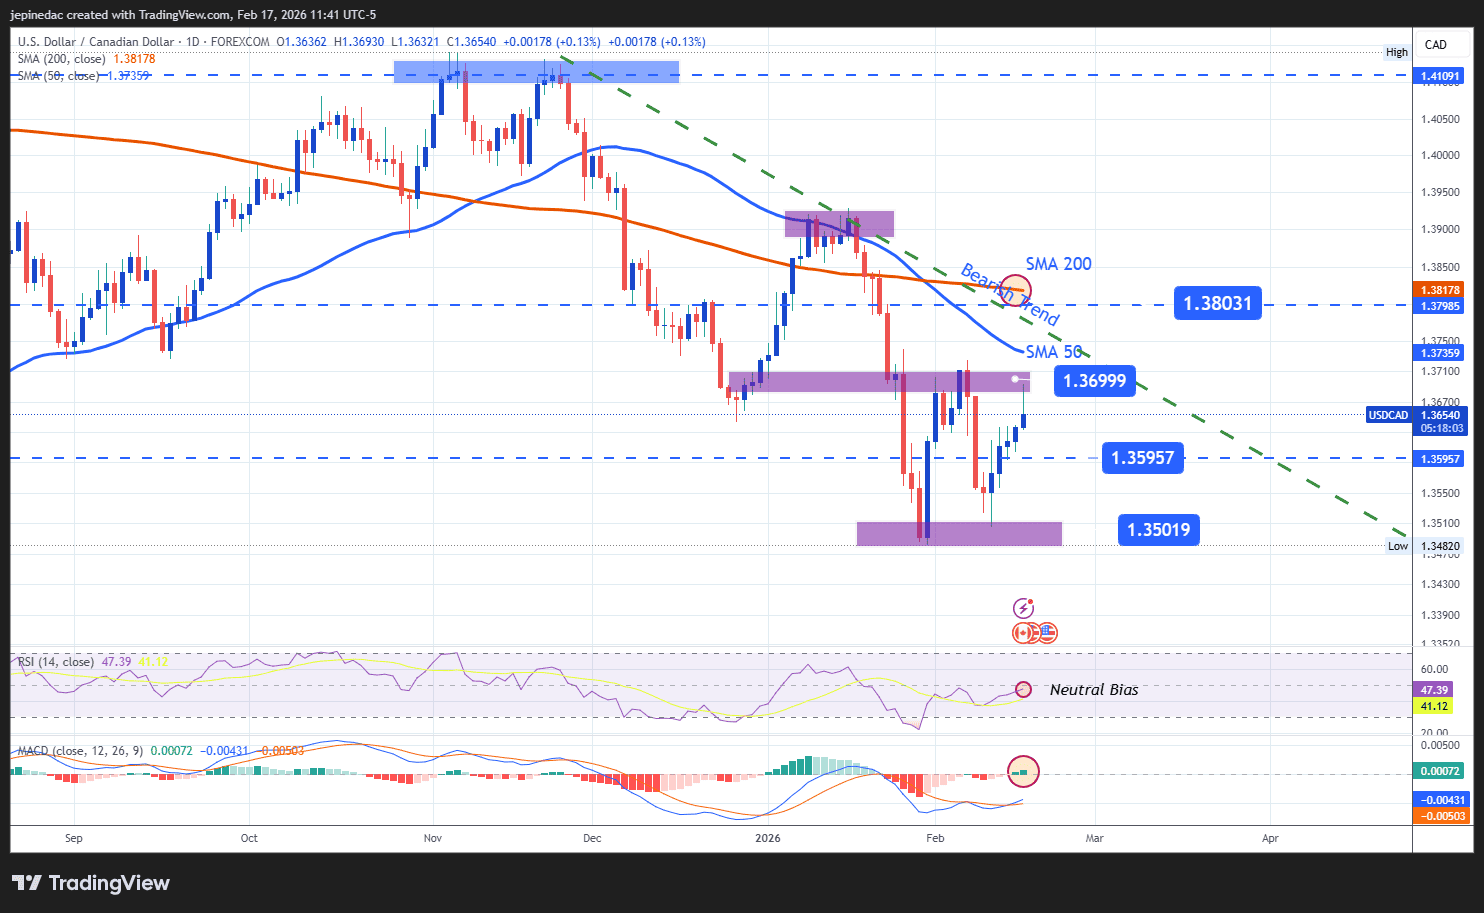
- Price Recovers, but the Broader Downtrend Persists: Since late November 2025, USD/CAD has maintained consistent bearish oscillations that led to the formation of a descending trendline on the daily chart. Despite the recent recovery, bullish movements have not yet been strong enough to break this technical structure. The pair appears to be entering a more neutral phase, where the downtrend is losing momentum, but without a clearly defined bullish pattern emerging. In this context, a period of sideways consolidation or short-term indecision cannot be ruled out.
- RSI: The RSI line is approaching the neutral 50 level, suggesting that average momentum over the past 14 sessions is balanced. This behavior reinforces the possibility of a consolidation phase in USD/CAD price action.
- MACD: A similar scenario is observed in the MACD, with the histogram hovering very close to the zero line, indicating no clear dominance in short-term moving average momentum and further confirming growing indecision in the pair.
Key Levels:
- 1.39966 – Key resistance: This level corresponds to recent weekly highs and lies near both the prevailing downtrend line and the 50-period moving average on the daily chart. A sustained move above this zone could challenge the bearish structure and pave the way for a stronger bullish bias, potentially signaling the start of a short-term uptrend.
- 1.35957 – Current barrier: A relevant neutrality zone aligned with significant retracements observed in July 2025. If price action fails to move decisively away from this level, a sideways consolidation phase could take shape in the short term.
- 1.35019 – Key support: Aligned with recent lows, this level represents the primary downside barrier. A sustained break below this area could enable new lows, reinforcing the dominant bearish bias from previous weeks and extending the medium-term downtrend.
Written by Julian Pineda, CFA, CMT – Market Analyst
Follow him on: @julianpineda25






