


Canadian Dollar Summary
USD trends are at an interesting spot following last week’s pullback from fresh four-month highs. A big spot of support came into play at the end of last week at 99.40 and that’s since led to a bounce in the USD to start this week. USD/JPY has led the way higher but USD/CAD can be of interest for bullish Dollar scenarios, as well, especially given the recent dynamics that saw the pair climb to a fresh six-month high last week before pulling back on Friday. But, at this point, that pullback appears to be a rectification of overbought conditions and so far, bulls have defended the psychologically important 1.4000 level in USD/CAD.

The sell-off continued through the weekly open with some additional Canadian Dollar strength weighing on the matter, illustrated by the fact that DXY held above its Friday low while USD/CAD pushed down for a fresh low coming just 1.2 pips away from the 1.4000 handle.
A second push of weakness in USD/CAD saw the pair fall to 1.4 pips away from 1.4000, with evidence of a slightly higher-low just two pipettes above the prior swing. That’s close enough for me to consider it a double bottom formation and, so far, that’s led to a bullish breakout and a rally in early US trade on Monday.
USD/CAD 30-Minute Chart (Candles) v/s DXY (Line)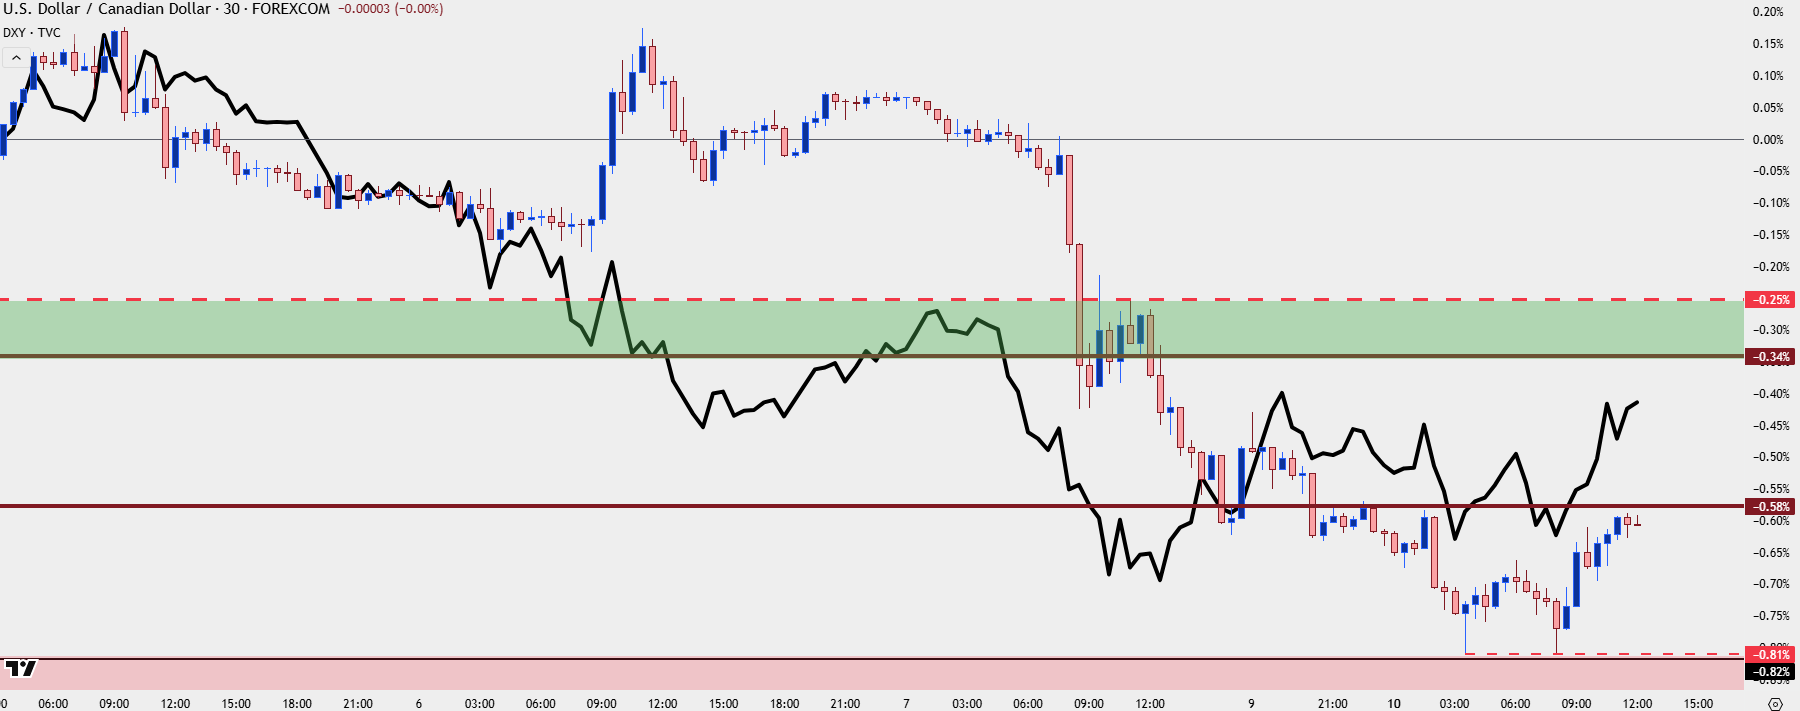
Chart prepared by James Stanley; data derived from Tradingview
USD/CAD Four-Hour
From the four-hour chart this sets up a potential morning star formation, which is a three-bar sequence highlighting the possibility of bullish reversal. The prior candle completed as a doji and the current candle still has a little time to completion, just under an hour, as of this writing. But this further points to the possibility of recovery in the pair following the snapback move on Friday of last week.
USD/CAD Four-Hour Chart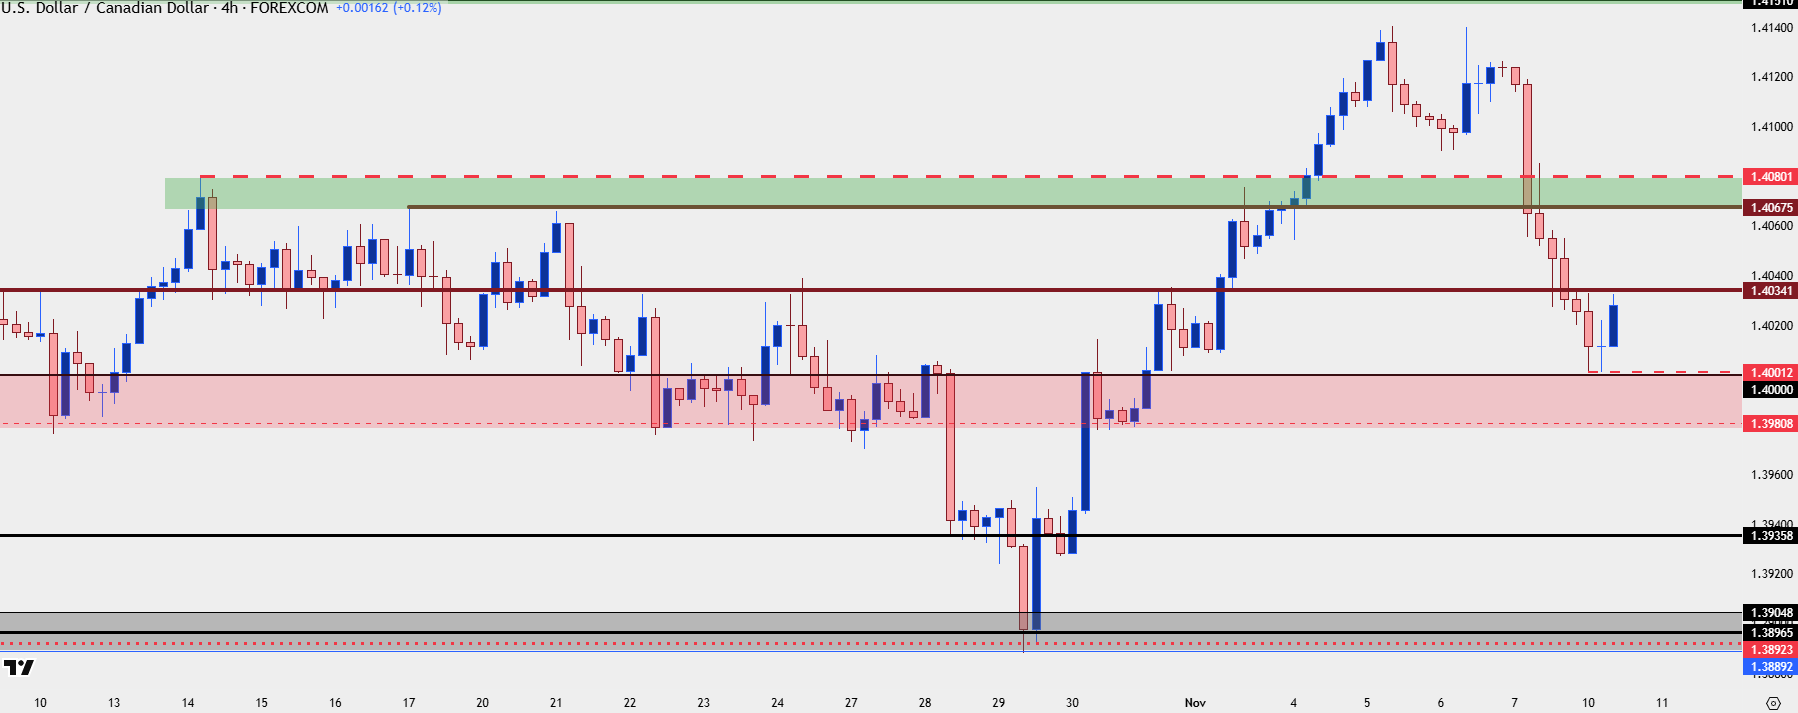
Chart prepared by James Stanley; data derived from Tradingview
USD/CAD Bigger Picture
From the daily, there’s a few nearby levels that stand out, and then a massive zone sitting overhead that price came a mere 10 pips away from on Wednesday and Thursday of last week. For shorter-term, the prior swing high at 1.4034 stands as next resistance, with the 1.4068-1.4080 zone sitting above that. If bulls can mount a break of 1.4034, 1.4068-1.4080 becomes the next objective at which point 1.4034 sets up as shorter-term higher-low support, giving some greater evidence of the broader bounce from the 1.4000 handle.
USD/CAD Daily Chart
Chart prepared by James Stanley; data derived from Tradingview
USD/CAD 1.4151-1.4178
The divergence between DXY and USD/CAD started to show in Q3 as USD/CAD built an ascending triangle, and even as DXY tripped down to a fresh low later in the quarter, USD/CAD broke out and held support at prior resistance, right around the 1.3750 handle.
As the Dollar came back to life in Q4 with the bullish breakout from the falling wedge, USD/CAD surged to above the 1.4000 handle. Since then, matters have been more tentative as a major psychological level of that nature often takes some time to gain acceptance. As a case in point, this was a key point of resistance back in May after the initial bounce from 1.3750; and this explains why the price is so important for near-term price action dynamics, because if we are seeing buyers jump on a perceived value with price a mere 1.2 pips above that level, it highlights bullish sentiment that can re-take control of trends and drive up for a test of fresh highs.
USD/CAD Weekly Chart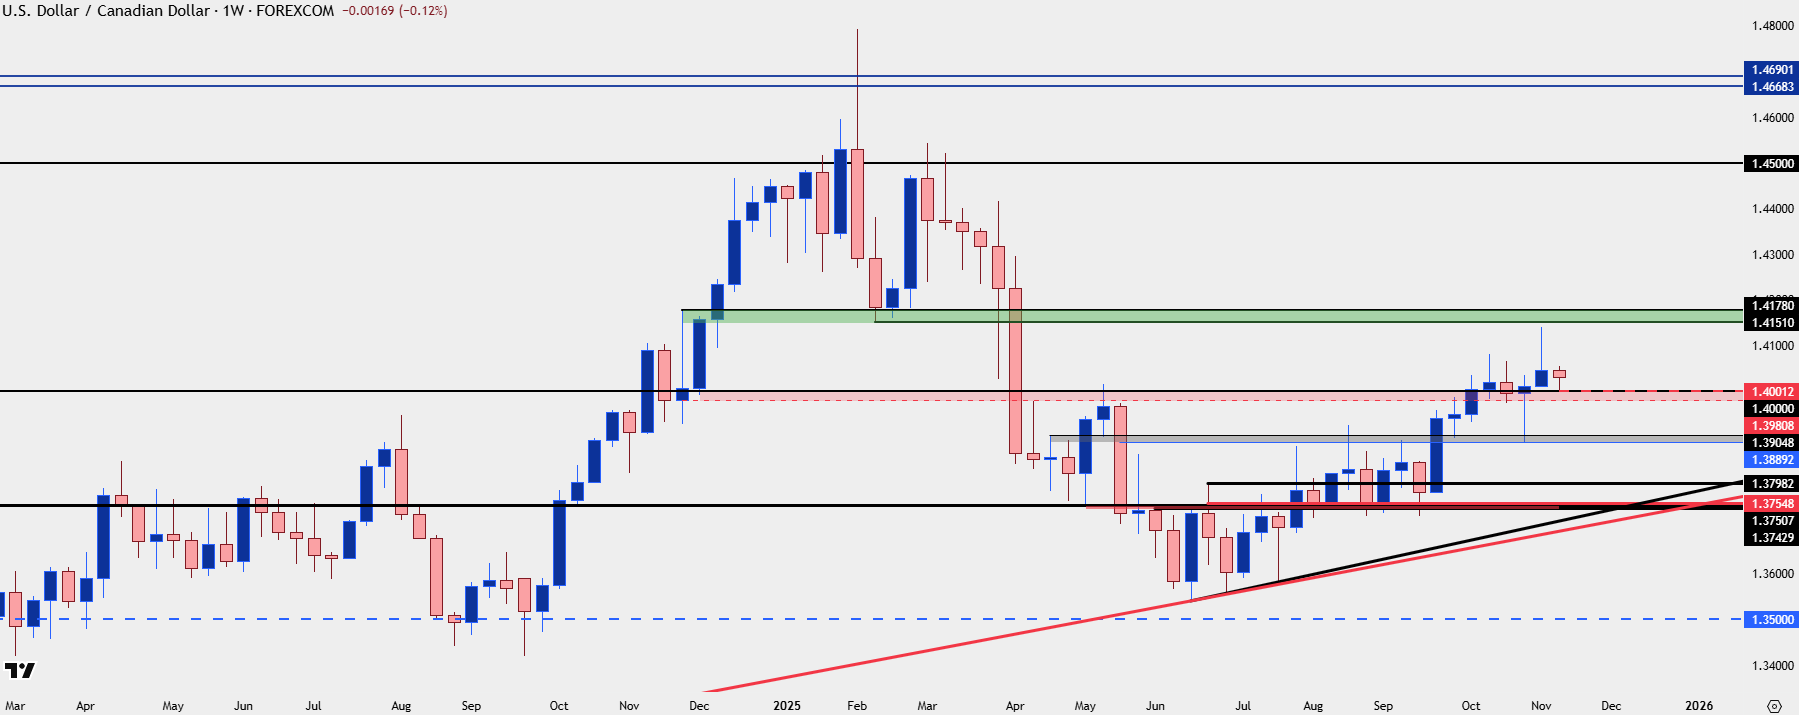
Chart prepared by James Stanley; data derived from Tradingview
--- written by James Stanley, Senior Market Analyst, Global Macro






