

It’s been a grinding start to 2026 for the US Dollar but that doesn’t mean there hasn’t been intrigue, and along with it, potential on either side of the currency. While the Japanese Yen still plays a massive role in broader Dollar dynamics there are probably more attractive setups, at least from a structural perspective, elsewhere.
I’ve been hitting on this topic in webinars over the past few weeks and for bullish USD scenarios USD/CAD may be a more attractive backdrop than USD/JPY.
The pair is currently re-testing a key resistance level at 1.3727 and this was a spot of support last year that set a double bottom formation that has more recently come back in to hold the highs on two separate occasions. That’s the spot that bulls now need to beat to take greater control of near-term trends and as looked at last week, buyers have so far held pullbacks above a zone of support from prior resistance at 1.3629-1.3643.
USD/CAD Daily Chart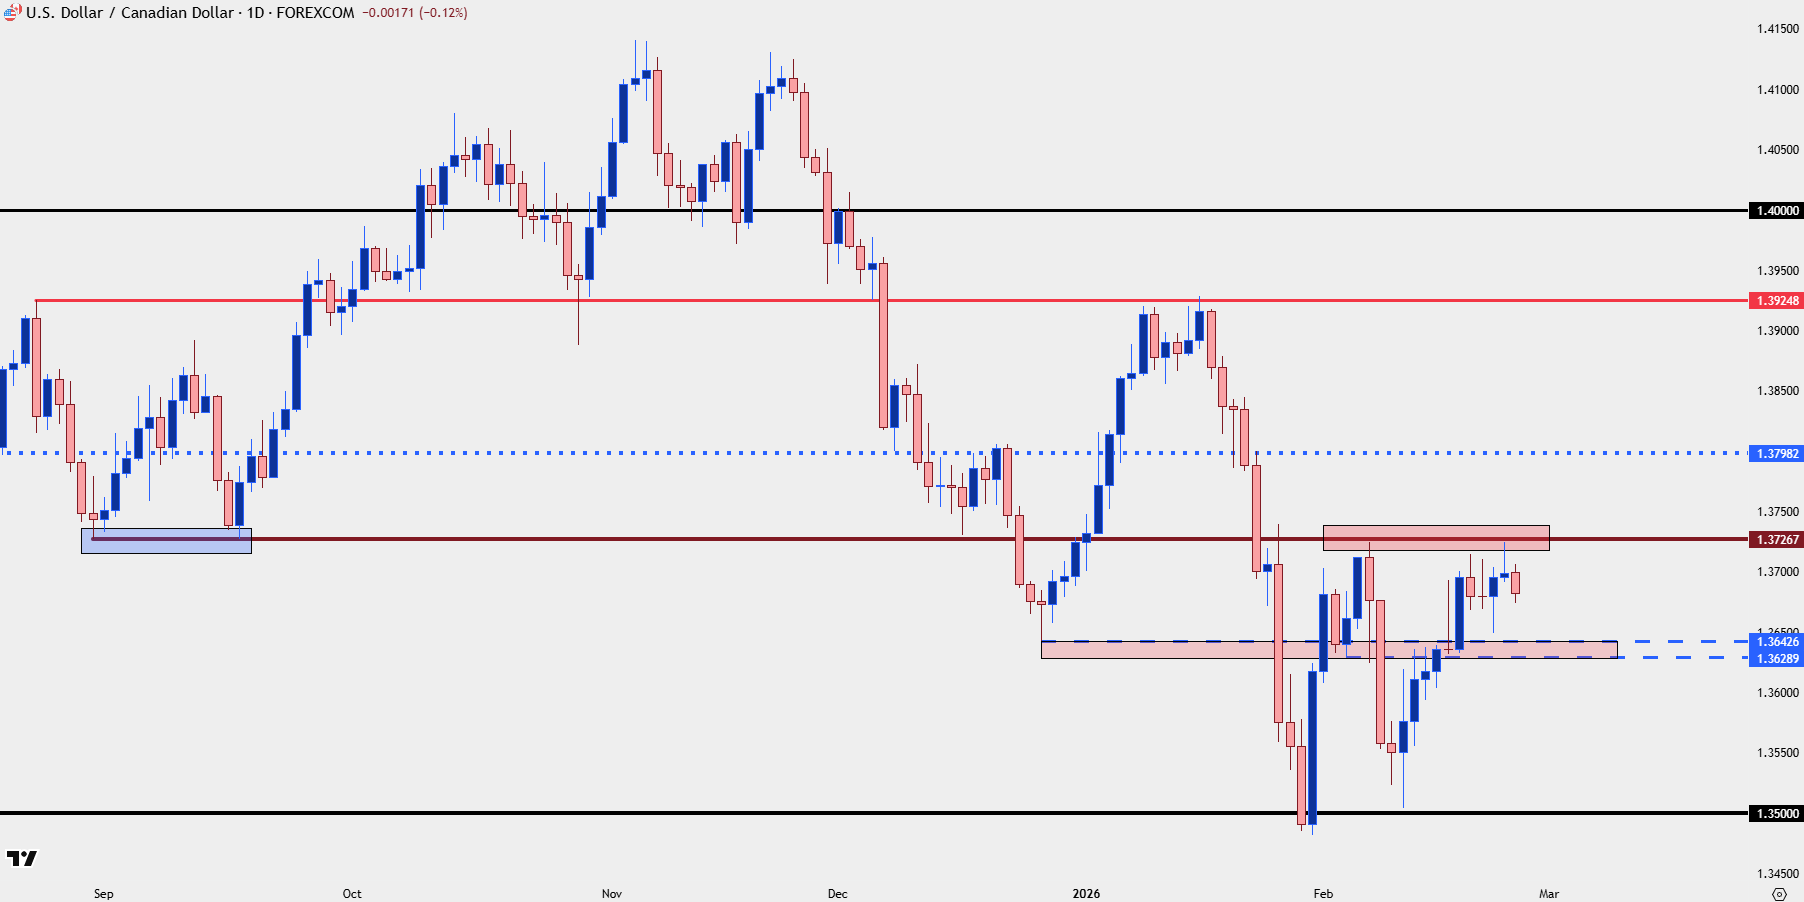
Chart prepared by James Stanley; data derived from Tradingview
USD/CAD Big Picture
I think the most notable item for the USD/CAD pair at the moment is the 1.3500 level, which has so far held support while helping to turn an aggressive sell-off into a moderate bounce. Like the ascending triangle formation that’s built in the US Dollar, there’s a similar backdrop in USD/CAD, with higher-lows to go along with that resistance at 1.3727.
The weekly chart shows the support hold cleanly and this is the key item that needs to remain in place for buyers to make more of a mark on a short-term basis. But also, evidence from this weekly chart is just how contentious 1.3727 has been, as four of the past five weeks have held at or below that line-in-the-sand.
That’s the spot for bulls to beat at the moment.
USD/CAD Weekly Price Chart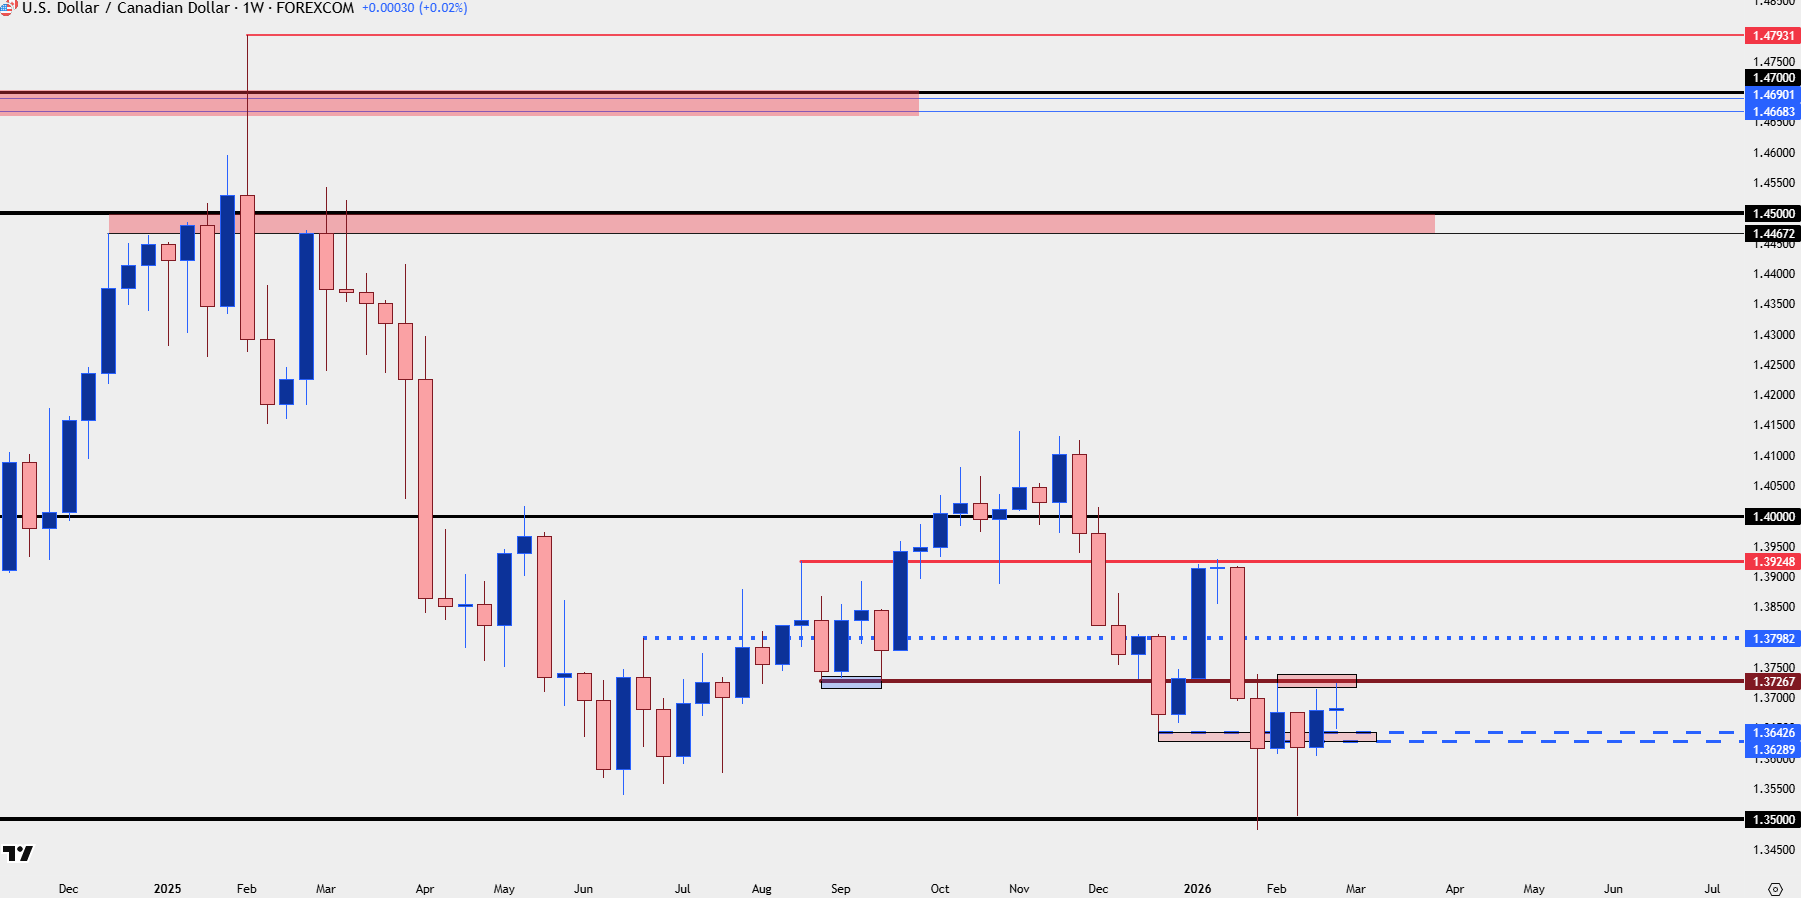
Chart prepared by James Stanley; data derived from Tradingview
--- written by James Stanley, Senior Market Analyst, Global Macro