


The first week of October is underway and, for now, the cryptocurrency market continues to display a mixed performance. Recent gains have been considerably smaller than those observed in previous weeks, while price action has struggled to generate moves strong enough to establish a clear direction across the market. As a result, a phase of lower activity and growing indecision is becoming increasingly evident among the major cryptocurrencies.
The inability of the market to break through key technical levels also reinforces this view. For now, cryptocurrencies appear to be developing within a broadly neutral environment that could remain relevant in the sessions ahead unless new catalysts emerge to restore momentum across the sector.

Performance of Major Cryptocurrencies
Source: Data - StoneX, Tradingview
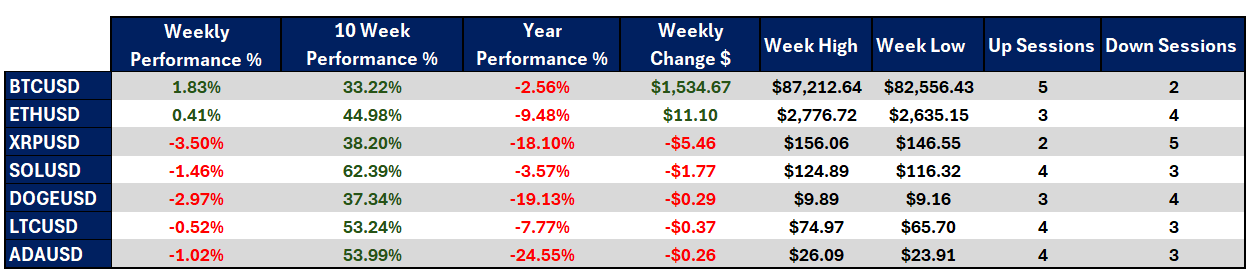
- The market has struggled to establish a clear short-term direction. Only a handful of cryptocurrencies have posted weekly moves above 3.00%, a much smaller magnitude than what was observed in previous weeks. Within this context, Bitcoin has been the only major cryptocurrency to maintain a meaningful positive performance with gains of approximately +1.83%, while Ripple has shown the weakest performance with a decline close to -3.50%. More importantly, these limited moves highlight a decline in market activity and a lack of directional conviction that continues to restrict the development of more structured trends.
- Looking at the last 10 weeks, the market continues to show a constructive medium-term picture. Prices remain above levels seen ten weeks ago, suggesting that the buying pressure observed in previous months has helped preserve stability across the sector. Solana continues to stand out with gains exceeding 60%, making it one of the strongest performers over this period. Meanwhile, Bitcoin has gained approximately 33.22%, a positive performance but lower than many of its peers. However, these figures have changed very little during the past week and currently reflect the broader recovery developed months ago rather than the market's present strength. As a result, if the current lack of direction continues, the broader crypto recovery could begin to enter a more meaningful consolidation phase.
- The yearly performance remains one of the sector's main challenges. Most cryptocurrencies continue to trade below the levels seen at the start of 2026, reflecting the lasting impact of the weakness recorded during the first months of the year. Cardano remains the weakest asset on a relative basis, posting losses of approximately -24.55%, while Bitcoin trades down around -2.56% for the year. This suggests that BTC remains one of the closest major cryptocurrencies to returning to positive annual territory, while the rest of the market is still attempting to establish a more complete recovery.
- Bitcoin, as the market's primary benchmark, ended the week in positive territory but only gained roughly $1,500. More importantly, the cryptocurrency continues to struggle below the key psychological barrier of $90,000, a situation that reflects the recent loss of momentum and limits the market's ability to regain stronger confidence.
- Overall, the market continues to develop under a clear sense of indecision. The buying pressure that dominated previous weeks has begun to fade and, for now, even Bitcoin has been unable to transmit enough confidence to the rest of the sector. As long as this lack of meaningful price action persists, market neutrality could remain a defining characteristic of the crypto space in the near term.
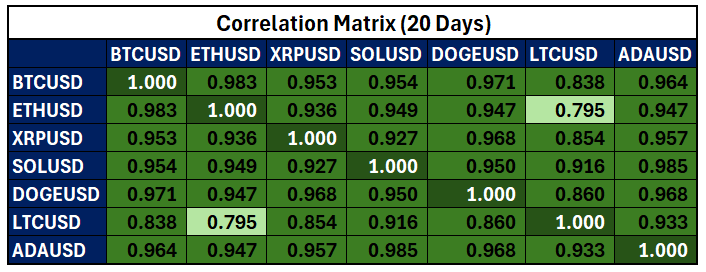
Colors from red to green. Red represents negative correlations and green represents positive correlations.
Source: Data - StoneX, Tradingview
From a correlation standpoint, it is also worth noting that the market remains highly tied to Bitcoin. Correlation coefficients between the main cryptocurrencies continue to trade above 0.8 over the last 20 sessions, reflecting a very strong positive relationship between BTC and the broader market. Correlation coefficients can change over time.
This remains important because it suggests that the crypto market continues to move in a highly synchronized manner. However, this strong relationship also means that the lack of direction currently affecting Bitcoin is spreading throughout the broader sector. In other words, there appear to be no significant catalysts capable of driving individual cryptocurrencies independently. As long as Bitcoin fails to regain stronger momentum, the current phase of indecision may continue to dominate the cryptocurrency market as a whole.
Bitcoin Begins to Show Signs of Consolidation
Source: StoneX, Tradingview
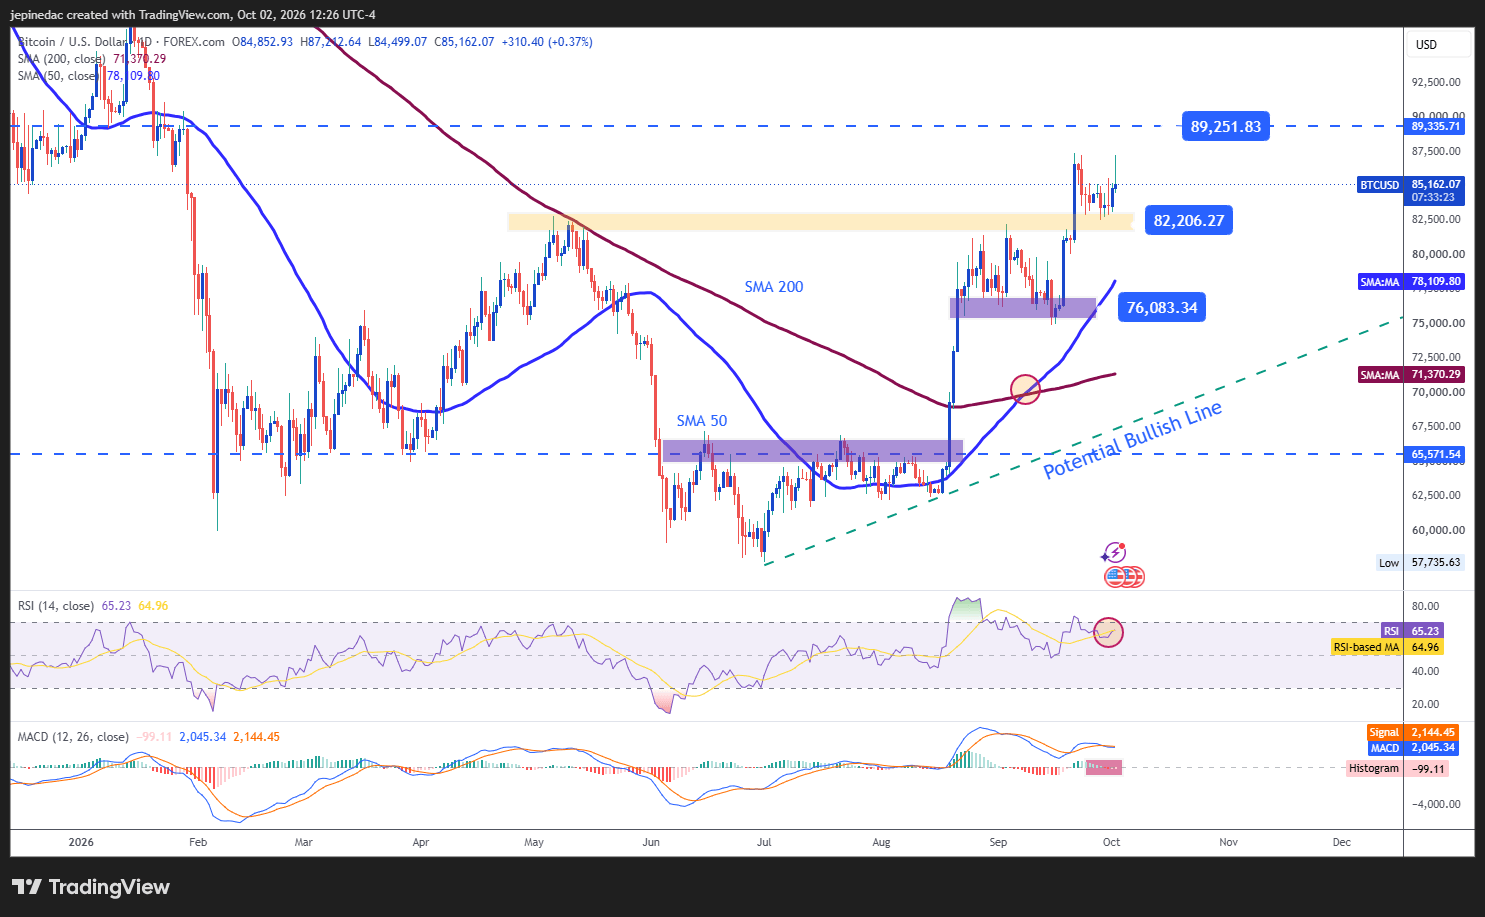
Although Bitcoin continues to maintain the bullish trendline developed in previous weeks, it is becoming increasingly clear that the recent period of neutrality is limiting the progression of this structure. The inability to generate new highs has begun to reflect a loss of momentum within the trend and could eventually lead to a more established consolidation phase if current conditions persist.
Indicators:
- The RSI has begun to display increasingly flat price action, while the MACD histogram continues to oscillate around the 0 neutral line. Together, these signals suggest a growing balance between buyers and sellers and support the idea that a phase of indecision may remain relevant in the short term.
Key Levels:
- $89,200 – Major Resistance: A high not seen since January and the most important upside barrier on the chart. Price action approaching this level could restore relevance to the bullish bias and revive the uptrend observed in previous months.
- $82,200 – Near-Term Barrier: An important equilibrium zone that has repeatedly acted as a retracement area over recent weeks and months. As long as Bitcoin continues to trade near this level, market neutrality may remain dominant and encourage the formation of a broader trading range.
- $76,000 – Key Support: A level that coincides with the 50-period simple moving average and remains one of the most important support areas on the chart. A move back toward this level could place the current bullish structure at risk and open the door to renewed selling pressure over the coming weeks.
Ripple Begins to Develop a Potential Trading Range
Source: StoneX, Tradingview
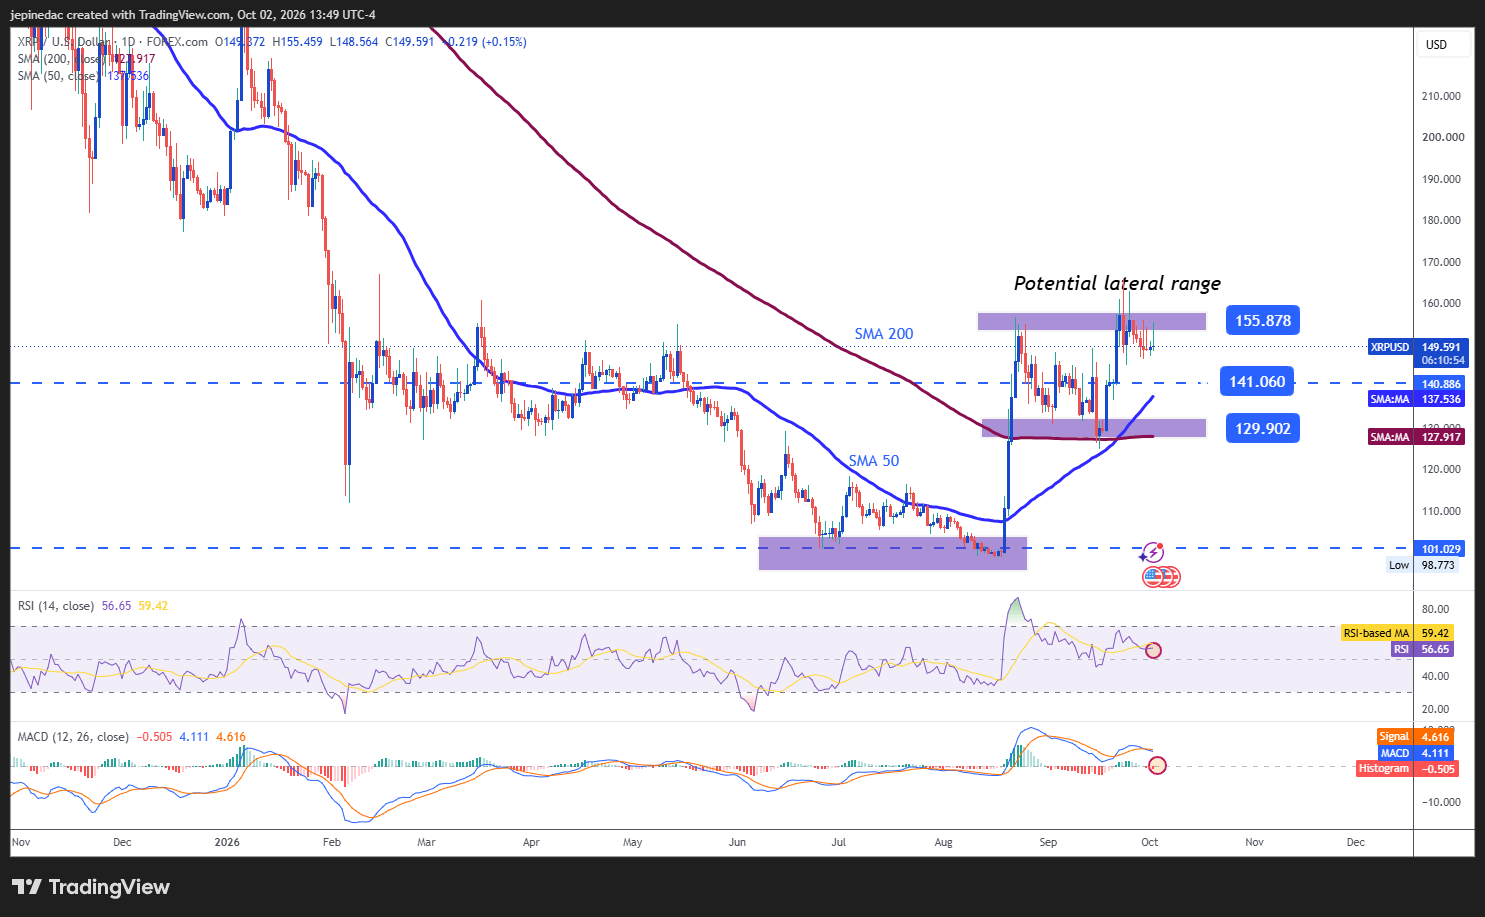
The lack of direction has also become increasingly evident in Ripple's recent price action. The cryptocurrency continues to trade within a potential trading range that currently stands as the dominant technical structure on the chart. Unless price is able to break decisively beyond the boundaries of this formation, neutrality may continue to dominate and limit the development of more established trends in the weeks ahead.
Indicators:
- Similar to Bitcoin, the RSI remains relatively flat while the MACD histogram continues to develop near the 0 neutral line. This behavior reflects a lack of directional conviction and supports the possibility that range-bound trading could continue to dominate short-term price action.
Key Levels:
- 155.87 – Major Resistance: An important recent high that marks the upper boundary of the current trading range. Sustained moves above this level could begin to favor a stronger bullish bias and open the door to a more structured uptrend.
- 141.00 – Near-Term Barrier: An equilibrium level that coincides with the midpoint of the current trading range. As long as price action remains concentrated around this area, the lack of direction may continue to be the dominant characteristic of the chart.
- 129.90 – Key Support: A significant support area that also aligns with the 200-period simple moving average. Price action returning toward this level could undermine the recovery observed in recent weeks and potentially give way to a more meaningful bearish bias over the coming weeks.
Written by Julian Pineda, CFA, CMT – Market Analyst
Follow him on: @julianpineda25






