



Crude Oil, Nasdaq, NVDA Outlook: Will Rising Oil Prices Cap the AI Rally?
Crude Oil, Nasdaq, NVDA Outlook: Crude oil prices remain elevated near the $100 mark as Nvidia (NVDA) earnings expectations surpass $78 billion. Latest outlook for crude oil, Nasdaq, and NVDA amid rising bond yields, inflation concerns, and Middle East tensions.
Share this:

Will rising oil prices cap the AI rally as bullish NVDA earnings expectations climb in a rising bond yield environment? Price action remains critical for confirming the next directional breakout across crude oil, Nasdaq, and Nvidia.
- NVDA earnings are expected to surpass $78 billion
- Concerns over priced-in AI optimism are rising as signs of market slowdown emerge on the charts
- Nasdaq pulled back over 3% from the 29,700 resistance/high while NVDA retreated over 7% from the 237 resistance/high
- Crude oil prices continue to hold near the $100 mark, adding pressure to inflation and bond yield expectations amid the upcoming FOMC minutes
Crude Oil Price Outlook: Weekly Time Frame – Log Scale
Source: Trading view
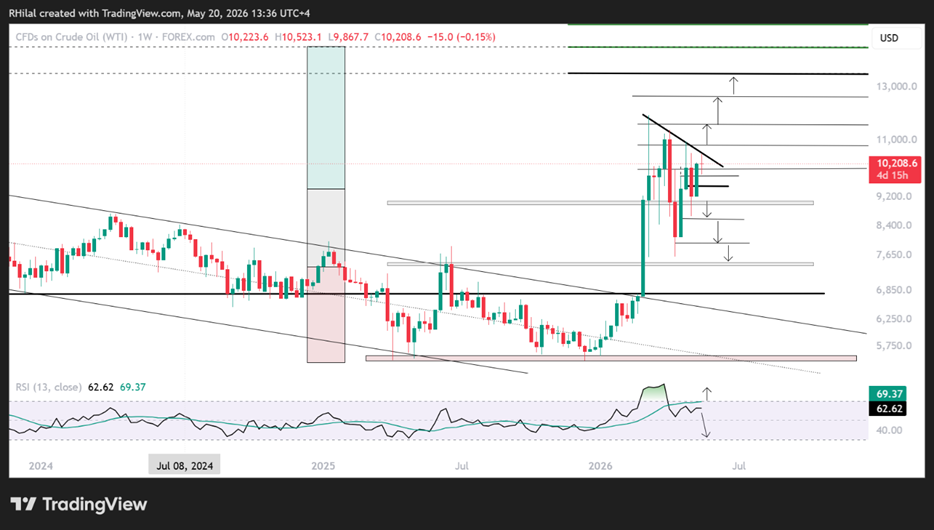
Crude oil price action continues to hold near the $100 mark, challenging the resistance trendline connecting the lower highs since March 2026. This keeps bullish breakout risks in focus should a sustained hold above the 108 level re-emerge, potentially weighing further on bond markets and limiting gains across markets, including the Nasdaq and Nvidia.
The inflationary environment is not driven solely by crude oil prices. Fertilizers, shipping costs, and broader supply chain pressures are also contributing. However, crude oil price action continues to reflect the direction of the Middle East conflict, keeping key intermarket scenarios in focus that could inversely impact the Nasdaq and NVDA.
Bullish Scenario for Crude Oil
A sustained breakout above 108 and 115 could expose another leg higher this year toward 126, 135, and 157. These levels align with the Fibonacci extension ratios of 0.618, 0.786, and 100% of the 2020–2022–2026 cycle.
This scenario would likely add further pressure to recent drawdowns across risk assets and the broader technology rally.
Bearish Scenario for Crude Oil
A sustained hold below the 2023 highs near the 88–91 barrier would reinforce the de-escalation narrative, exposing prices back toward 86, 82, and 79 before potentially retesting the previous Middle East conflict high near 76 for either another rebound or an extended bearish continuation.
This scenario would likely ease inflationary pressures across markets, allowing risk asset trends to resume should central bank policy shift toward a less hawkish stance
Nasdaq Price Outlook: Weekly Time Frame – Log Scale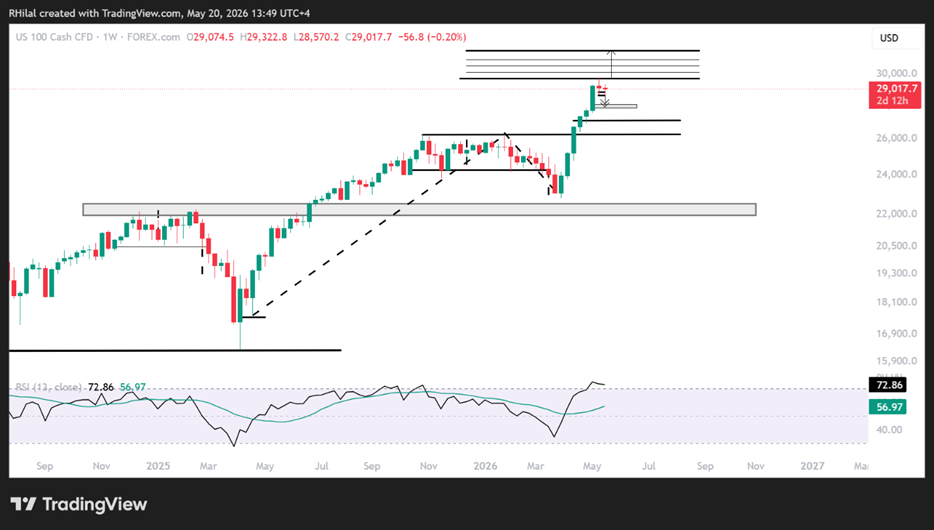
Source: Trading view
Nasdaq remains below the 78.6% Fibonacci extension of the April 2021 2025 – October 2025 – March 2026 cycle.
Bullish Scenario for Nasdaq
A sustained hold back above 29,700 would expose gains toward the 30,100 psychological mark, followed by 30,500 and 30,900 as short-term resistance levels. The 31,500 level, aligning with the 100% Fibonacci extension, remains a higher probability setup for the next major resistance zone.
Bearish Scenario for Nasdaq
A sustained hold below 28,600 exposes downside risks toward 28,000, 27,800, and 27,000, aligning with Fibonacci retracement ratios of the impulse move between this year’s lows and highs, March-May 2026.
The more extreme bearish scenario would target the 50% retracement near the highs of the 2025–2026 consolidation around 26,200, which remains a higher probability zone for a bullish rebound setup / dip buying opportunity.
Related video: Nasdaq Rally Faces Inflation Risks as Bond Yields Threaten AI Momentum
NVDIA Price Outlook: Daily Time Frame – Log Scale
Source: Trading view
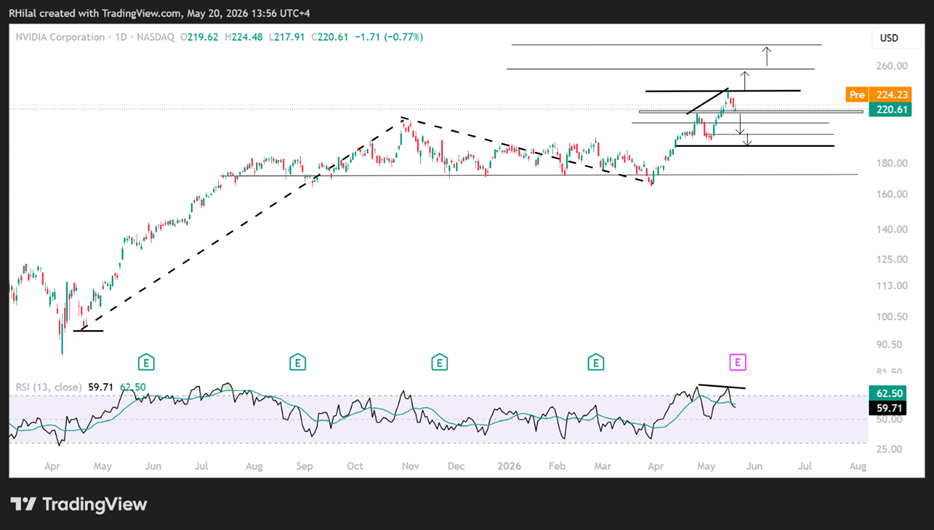
NVDA continues to trade in a similar structure to the Nasdaq, remaining below the 237 resistance level, which aligns with the 0.618 Fibonacci extension of the wave between April 2021, October 2025, and March 2026.
Bullish Scenario for NVDA
A sustained hold above the 237 mark exposes upside potential toward the 78.6% and 100% Fibonacci extension ratios near 256 and 287.
Bearish Scenario for NVDA
In line with the bearish divergence and overbought RSI conditions on the daily time frame, a sustained hold below the 217 support level — a previously respected resistance and the 0.272 Fibonacci retracement ratio of this year’s uptrend — exposes downside risks toward 209, 200.60, and 192.
The 192 zone remains a higher probability rebound setup, aligning with the 0.618 Fibonacci retracement ratio.
Price action and intermarket confirmation will remain critical in navigating the noise between AI demand, the implications of the Middle East conflict, and the shifting sentiment surrounding US-Iran tensions.
Written by Razan Hilal, CMT
Follow on X: @Rh_waves
Latest market news



Open an account in minutes
Experience award-winning platforms with fast and secure execution.
Economic calendar
Web Trader platform
Our sophisticated web-based platform is packed with features.
Related articles
British Pound Forecast: GBP/USD Plunge Puts Yearly Range on the Line 11 12 2026
Sterling’s failed recovery has GBP/USD closing in on critical trend support, with the next weekly close poised to shape the November outlook.
Canadian Dollar Technical Outlook: USD/CAD 2% Rally Puts Yearly Highs Back in Play 11 12 2026
A sharp reversal from critical support has revived USD/CAD bulls, with a major resistance test now in focus that could determine the fate of the recovery.
Nasdaq 100 Forecast: Nvidia CEO Huang is Out – What’s Next for NDX?
While the issue is as idiosyncratic as it gets, Nvidia’s turmoil may nonetheless have broader market implications for the Nasdaq 100 and AI trade as a whole.

The information on this web site is not targeted at the general public of any particular country. It is not intended for distribution to residents in any country where such distribution or use would contravene any local law or regulatory requirement. The information and opinions in this report are for general information use only and are not intended as an offer or solicitation with respect to the purchase or sale of any currency or CFD contract. All opinions and information contained in this report are subject to change without notice. This report has been prepared without regard to the specific investment objectives, financial situation and needs of any particular recipient. Any references to historical price movements or levels is informational based on our analysis and we do not represent or warranty that any such movements or levels are likely to reoccur in the future. While the information contained herein was obtained from sources believed to be reliable, author does not guarantee its accuracy or completeness, nor does author assume any liability for any direct, indirect or consequential loss that may result from the reliance by any person upon any such information or opinions.
Futures, Options on Futures, Foreign Exchange and other leveraged products involves significant risk of loss and is not suitable for all investors. Losses can exceed your deposits. Increasing leverage increases risk. Spot Gold and Silver contracts are not subject to regulation under the U.S. Commodity Exchange Act. Contracts for Difference (CFDs) are not available for US residents. Before deciding to trade forex, commodity futures, or digital assets, you should carefully consider your financial objectives, level of experience and risk appetite. Any opinions, news, research, analyses, prices or other information contained herein is intended as general information about the subject matter covered and is provided with the understanding that we do not provide any investment, legal, or tax advice. You should consult with appropriate counsel or other advisors on all investment, legal, or tax matters. References to FOREX.com or GAIN Capital refer to StoneX Group Inc. and its subsidiaries. Please read Characteristics and Risks of Standardized Options.