
The first week of March comes to an end, and with it the recent lack of activity in the cryptocurrency market has become increasingly evident. Major cryptocurrencies have begun to show mixed behavior, without a clearly defined direction in the short term.
Although Bitcoin, as the market’s reference index, managed at one point to break above the $70,000 level, it has since shown renewed weakness and closes the week below that threshold. This highlights that the lack of consistent strength is not limited to Bitcoin but is also visible across the broader crypto market. As long as concrete moves and sustained breakouts of key levels remain absent, a phase of indecision could persist for the main cryptocurrencies in the coming sessions.

Performance of Major Cryptocurrencies
Source: Data - StoneX, Tradingview
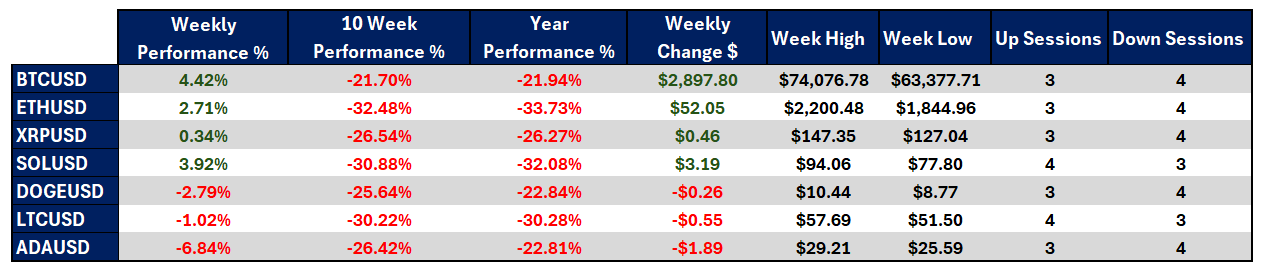
- The cryptocurrency that has managed to maintain the most stability toward the weekly close has been Bitcoin, posting a 4.42% gain compared to the previous week’s close. While this does not represent a meaningful recovery, it does show short-term stabilization. Meanwhile, Cardano has once again been among the most affected, registering a -6.84% decline. This suggests that rather than indecision, a more consistent weakness has settled over this cryptocurrency in recent sessions.
- Looking at the past ten weeks, the crypto market continues to trade well below levels seen at the end of 2025, maintaining a dominant medium-term bearish bias. During this period, Ethereum has fallen -32.48%, while Bitcoin is down -21.70%, showing relatively better stability but still under clear downside pressure.
- Year-to-date, all major cryptocurrencies trade below their annual opening prices. Ethereum (-33.73%) and Solana (-32.08%) lead the decline, while Bitcoin (-21.94%) shows the strongest relative performance, although it remains in negative territory.
- Bitcoin, as the primary market reference, has begun to show larger average weekly price variations compared to previous weeks, with a weekly change of approximately $2,900. However, this remains a moderate move, reflecting limited momentum in the broader crypto market. The weekly high surpassed $74,000, but the breakout failed to sustain buying strength, and price continues to fluctuate within a defined range, highlighting ongoing short-term indecision.
- Overall, the week has been clearly indecisive, with consistent signs of weakness in the crypto market. While some cryptocurrencies attempted to recover part of their losses, these moves remain insufficient to reverse the dominant bearish bias of previous weeks, and the market has failed to close the week in consistently positive territory.
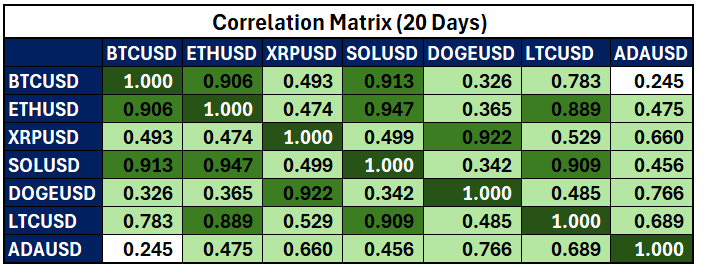
Colors from red to green – Red for negative correlations and green for positive correlations
Source: Data - StoneX, Tradingview
From a correlation standpoint, some cryptocurrencies have begun to diverge from Bitcoin’s movements. Currently, correlation coefficients are below 0.6 for assets such as Doge, Cardano, and Ripple, and below 0.9 for Litecoin. This reflects a loss of similarity between broader market movements and Bitcoin’s behavior as the reference asset. It is important to note that correlation coefficients may change over time.
Although correlations remain positive, the intensity with which price movements are replicated across cryptocurrencies has declined consistently over the past two weeks. This suggests the market is beginning to display more mixed behavior in the short term: while Bitcoin attempts to maintain stability, other cryptocurrencies continue to show more aggressive weakness.
In this environment, the sense of indecision has become more entrenched. There is no broad-based confidence benefiting the sector as a whole; rather, recovery attempts depend on isolated events in specific cryptocurrencies, while stability has largely been concentrated in higher-capitalization assets.
If the loss of correlation and mixed movements persist, a more pronounced phase of neutrality could consolidate in the coming sessions, with more moderate fluctuations compared to the beginning of the year. Additionally, Bitcoin is not leading a confidence-driven move across the broader market, making indecision the dominant factor. This scenario could result in prolonged sideways movements throughout the cryptocurrency market in the near term.
Bitcoin Attempted to Recover, But It Was Not Enough
Source: StoneX, Tradingview
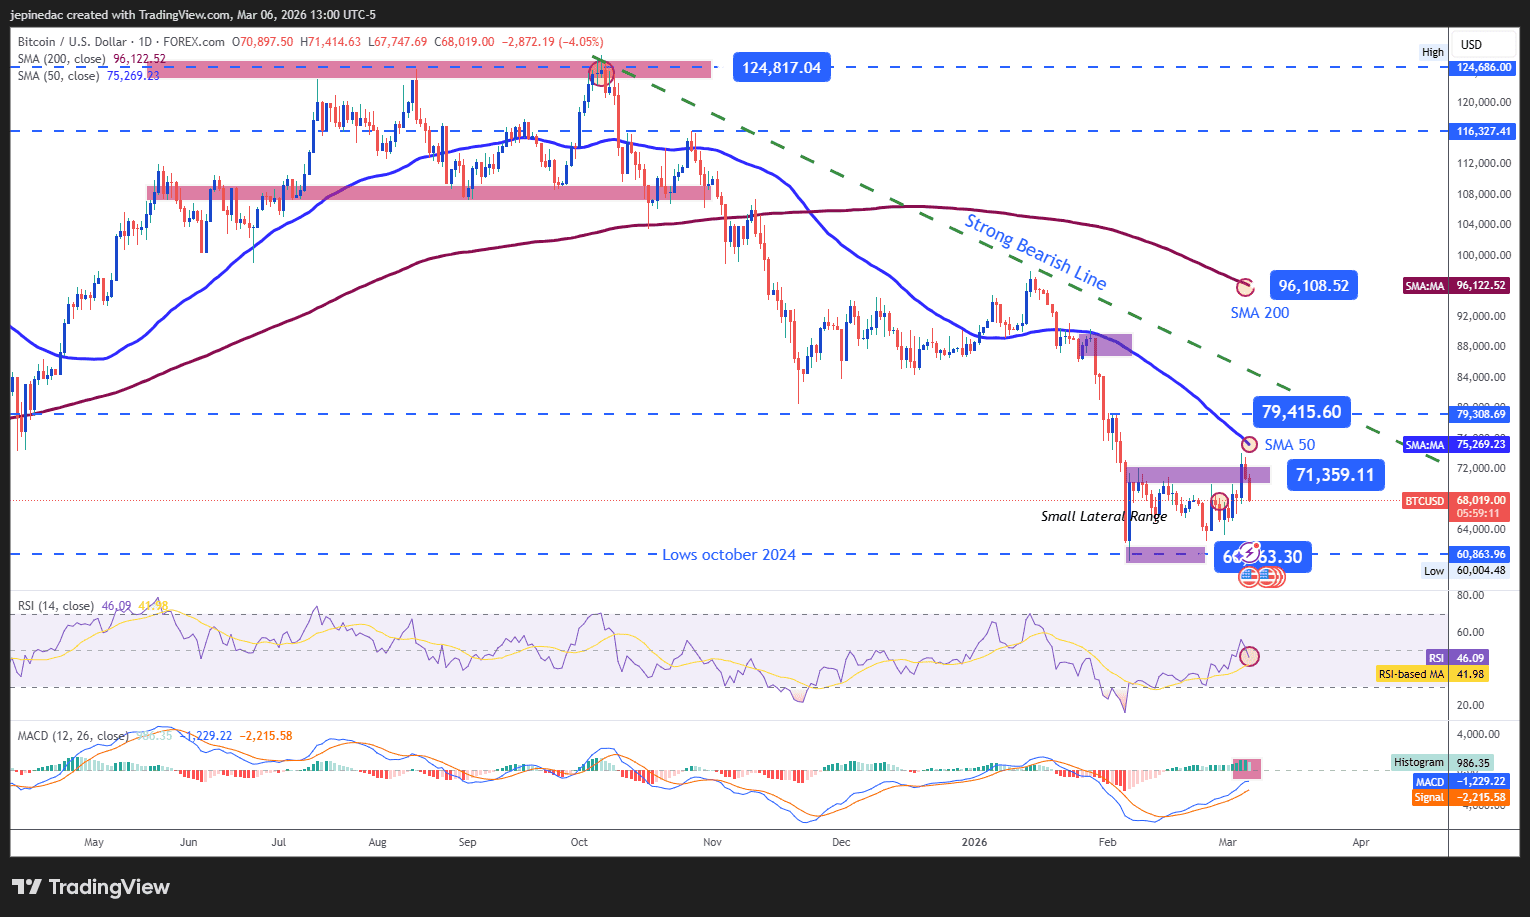
Although Bitcoin was among the more stable cryptocurrencies during the week, average price movements have failed to break the consistent sideways range between $71,300 and the $60,600 support level. As long as these levels are not decisively broken, neutrality is likely to continue dominating short-term price action.
It is also important to note that the primary long-term chart pattern remains the descending trendline that has been forming for several months. So far, no sufficiently strong bullish move has emerged to threaten this technical structure, meaning the broader bearish bias remains intact.
Indicators:
- Both the RSI and MACD have begun to show flattening behavior, with the RSI hovering near the neutral 50 level and the MACD around the zero line. This reflects consistent equilibrium in market momentum and a lack of clear directional strength in the short term, suggesting that indecision may persist in the coming sessions.
Key Levels:
- $79,400 – Relevant resistance: Area of previous weekly highs, positioned above the 50-period moving average. A sustained breakout could reactivate a buying bias and threaten the dominant bearish structure.
- $71,350 – Near-term barrier: Upper boundary of the short-term sideways range. Without a decisive move away from this level, current consolidation may persist.
- $60,600 – Key support: A level not seen since October 2024. A sustained break below this zone could reactivate the broader downtrend and restore selling dominance.
Dogecoin Approaches Recent Lows
Source: StoneX, Tradingview
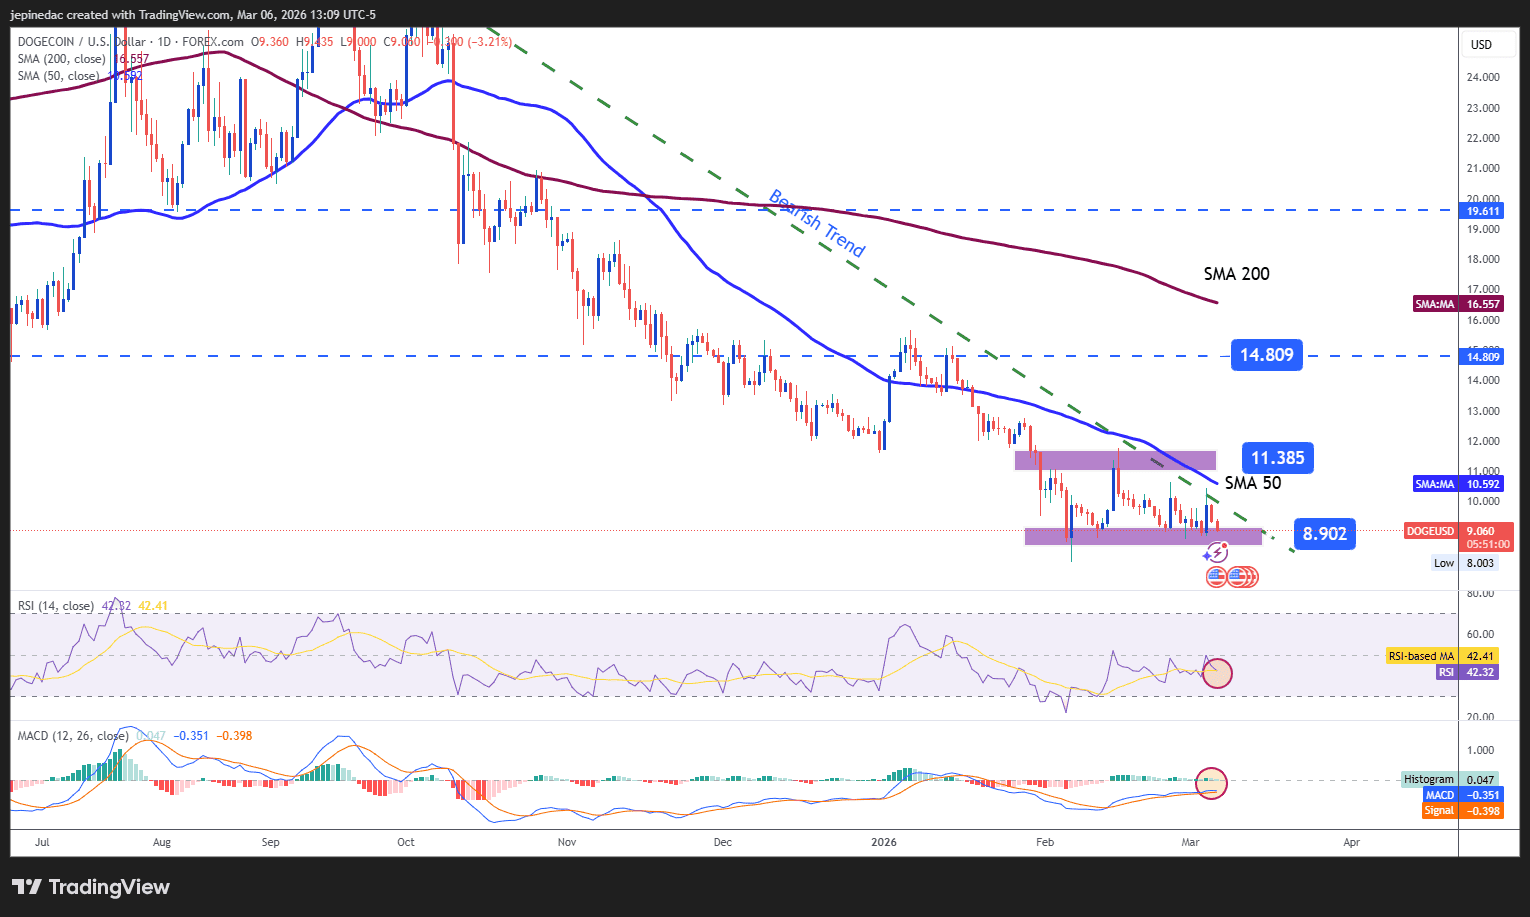
Dogecoin has been one of the most affected cryptocurrencies this week, posting continued losses and showing a consistent bearish bias. Price remains within a long-term descending trendline that has been forming for months. If selling pressure persists and key support levels break, this bearish trend could become even more dominant in the coming sessions.
Indicators:
- The RSI remains below the neutral 50 level, indicating that selling momentum continues to dominate. Meanwhile, the MACD histogram remains close to the zero line, reflecting an element of indecision in short-term moving average momentum. Together, these indicators highlight the ongoing rotation between weakness and indecision that has characterized recent price action.
Key Levels:
- 14.80 – Major resistance: Level corresponding to the most relevant high above the descending trendline. A breakout could open the door to the formation of a new upward trendline in the coming weeks.
- 11.38 – Near-term barrier: Area aligned with the 50-period simple moving average and the descending trendline. A sustained break above this level would threaten the current bearish structure and could establish a short-term dominant buying bias.
- 8.90 – Key support: Level aligned with relevant lows within the broader downtrend. A decisive break below this area could trigger a dominant selling bias and extend the prevailing bearish structure in the coming sessions.
Written by Julian Pineda, CFA, CMT – Market Analyst
Follow him on: @julianpineda25