


Cyclical stocks sniff out better times ahead
Different economies, different drivers, similar price action. The German DAX, ASX 200 and Russell 2000 are all hinting at a more optimistic view on the global economy.
Share this:

- DAX breaks to fresh record highs
- ASX 200 clears late July resistance
- Russell 2000 snaps month-long downtrend
DAX, ASX 200 and Russell charts align
The German DAX, Australia's ASX 200 and Russell 2000 in the States don't have much in common. Different economies, different sector weightings and different domestic drivers. Yet over recent sessions, the price action has started to look remarkably similar.
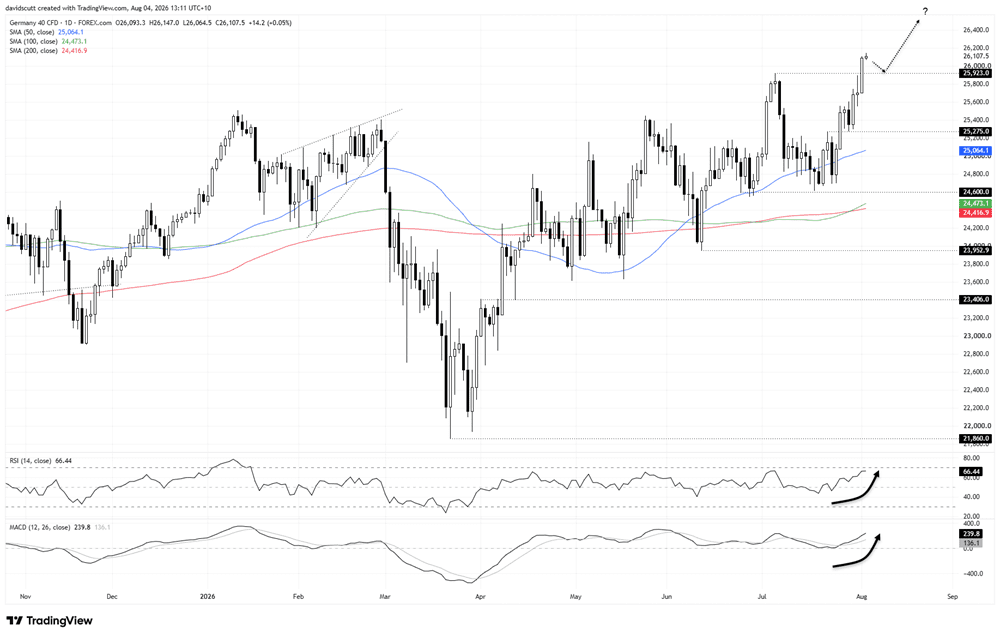
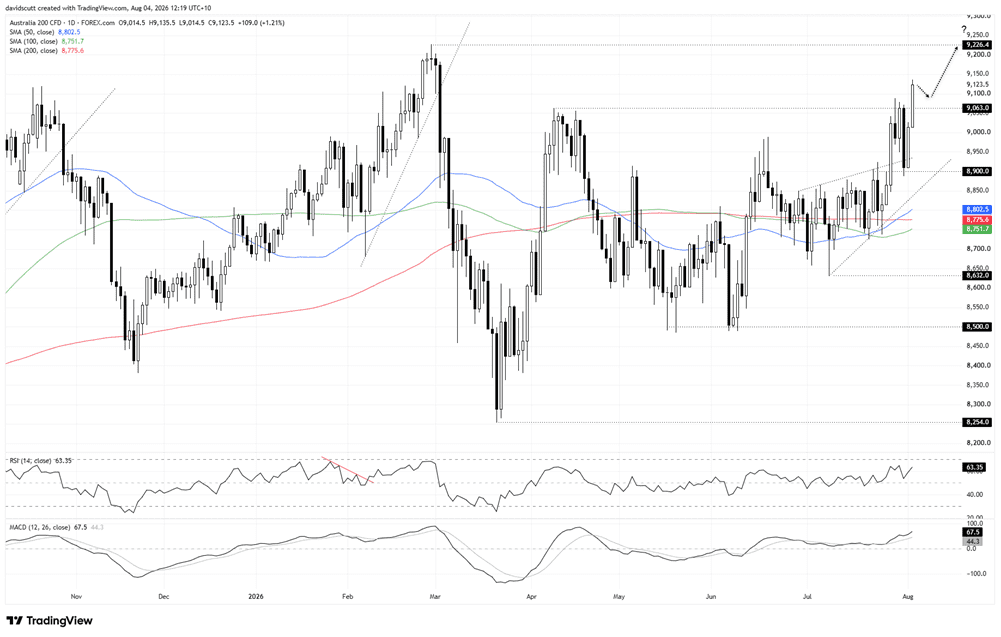
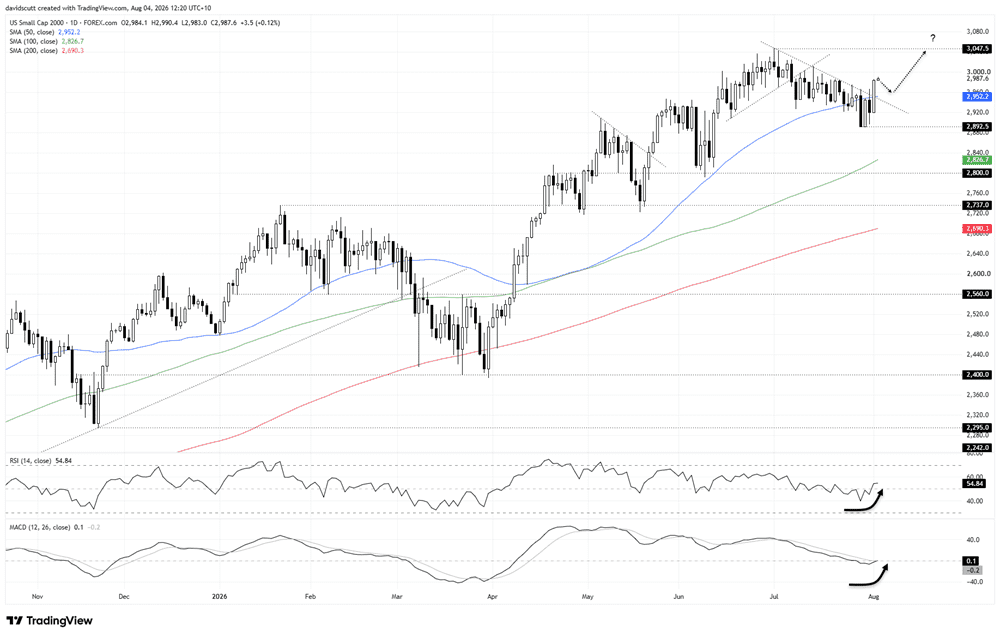
The DAX has broken to fresh record highs, the ASX 200 has pushed above the highs set in late July, while the Russell has broken above the downtrend that's capped rallies over the past month.
As anyone who's watched them for a significant period can attest, markets don't wait for economists or data to tell them the outlook is changing. They often move first. Looking at these charts together, it feels like they're starting to price a brightening macroeconomic picture.
Maybe it's the recent slide in energy prices on what feels like eternal Middle East peace hopes. Maybe it's the view that the recent intervention episode to support the yen has reduced one of the risks that had been building in global bond markets. Maybe traders think the highs are in for inflation. Or maybe it's something else like the return of liquidity post month-end.
Whatever the reason, it's difficult to ignore that these cyclical plays are starting to behave in a similar fashion. While it could prove to be yet another false dawn, when the charts start lining up like this, it’s worth paying attention.
DAX breaks to fresh record highs
Source: TradingView
Germany's DAX has broken to fresh record highs after clearing resistance at 25,923, extending the bull move that's been building since the rebound from 24,600. The breakout above 25,275 and subsequent backtest added conviction that buyers remained in control.
The broader technical picture continues to favour upside. The price trades above rising key medium and long-term moving averages, RSI (14) is pushing higher at 66 without being overbought, while MACD has staged a bullish crossover and continues to strengthen in positive territory.
The setup therefore favours bulls. I just don't see enough to justify chasing fresh record highs right now.
For one, the last break to record highs earlier this year fizzled quickly. Secondly, the macro backdrop may prove just as important as the technicals when it comes to the breakout's longevity.
Germany remains heavily reliant on imported energy, meaning the recent slide in crude oil prices on hopes of a lasting Middle East peace deal has provided a near-term tailwind. But whether it lasts, or simply proves to be another false dawn in this ongoing geopolitical saga, may determine whether this breakout sticks.
While some may be prepared to buy the breakout immediately, I'd rather wait for a backtest of 25,923. If former resistance flips to support, it would provide far greater confidence that this is a genuine breakout to chase.
At record highs, trying to pick an upside target feels like guesswork. Instead, I'll be watching for reversal patterns on the daily timeframe, such as a bearish engulfing pattern, shooting star, evening star or key reversal, as an early warning that the bull move may be running out of steam.
ASX 200 bulls eye record highs
Source: TradingView
While the ASX 200's price action isn't always the cleanest, it's obvious the bulls are winning the battle right now.
The index has rebounded strongly from 8,900, a level that's acted as both support and resistance over recent weeks, before surging above 9,063 today. That follows several failed attempts to clear the level last week, adding to confidence that buyers are finally regaining control.
The oscillators are also on board. RSI (14) sits at 63, still short of overbought territory and pointing to building upside momentum, while MACD has staged a bullish crossover and continues to diverge from its signal line in positive territory.
Like the DAX, some may be prepared to buy the breakout immediately. Given the risk of another escalation in geopolitical tensions that could quickly challenge the narrative, I'd rather wait for a backtest of the former resistance zone between 9,063 and 9,100. The area attracted plenty of price action late last year and again in recent weeks, making it an important zone to watch. If it flips to support, longs could be considered with a tight stop below 9,063, targeting a retest of the record high at 9,226.4.
Russell 2000 joins the breakout club
Source: TradingView
The Russell 2000 broke above the downtrend that had been in place since the start of July on Monday, clearing the 50-day simple moving average in the process.
Again, some may be prepared to buy the breakout immediately. I'd rather wait for a pullback towards 2,960 or the 50-day simple moving average before considering entry. If either holds as support, longs could be considered with a tight stop beneath those levels for protection, targeting a retest of the record high at 3,047.5.
The broader technical picture continues to favour upside. The price trades above all the key medium and long-term moving averages, RSI (14) has shifted back above the neutral 50 level. That view is confirmed by MACD, which has staged a bullish crossover of the signal line and is now moving into positive territory.


Open an account in minutes
Experience award-winning platforms with fast and secure execution.
Economic calendar
Web Trader platform
Our sophisticated web-based platform is packed with features.
Related articles
Gold coils for potential breakout as US CPI looms
Gold's ascending triangle is putting $4,140 firmly in focus ahead of US CPI. With traditional macro relationships offering few clues, the price action may prove more useful for traders.

USD/CAD Outlook: Loonie left behind as US CPI looms
USD/CAD's sharp rebound has coincided with widening US–Canada interest rate differentials. With US CPI approaching and bullish momentum building, another breakout may be on the cards.

Japanese Yen Outlook: EUR/JPY and GBP/JPY Outbid USD/JPY
The Japanese yen starts the week mixed, with EUR/JPY and GBP/JPY showing bullish potential while USD/JPY remains stuck in a rut.

The information on this web site is not targeted at the general public of any particular country. It is not intended for distribution to residents in any country where such distribution or use would contravene any local law or regulatory requirement. The information and opinions in this report are for general information use only and are not intended as an offer or solicitation with respect to the purchase or sale of any currency or CFD contract. All opinions and information contained in this report are subject to change without notice. This report has been prepared without regard to the specific investment objectives, financial situation and needs of any particular recipient. Any references to historical price movements or levels is informational based on our analysis and we do not represent or warranty that any such movements or levels are likely to reoccur in the future. While the information contained herein was obtained from sources believed to be reliable, author does not guarantee its accuracy or completeness, nor does author assume any liability for any direct, indirect or consequential loss that may result from the reliance by any person upon any such information or opinions.
Futures, Options on Futures, Foreign Exchange and other leveraged products involves significant risk of loss and is not suitable for all investors. Losses can exceed your deposits. Increasing leverage increases risk. Spot Gold and Silver contracts are not subject to regulation under the U.S. Commodity Exchange Act. Contracts for Difference (CFDs) are not available for US residents. Before deciding to trade forex, commodity futures, or digital assets, you should carefully consider your financial objectives, level of experience and risk appetite. Any opinions, news, research, analyses, prices or other information contained herein is intended as general information about the subject matter covered and is provided with the understanding that we do not provide any investment, legal, or tax advice. You should consult with appropriate counsel or other advisors on all investment, legal, or tax matters. References to FOREX.com or GAIN Capital refer to StoneX Group Inc. and its subsidiaries. Please read Characteristics and Risks of Standardized Options.