


Are the rallies across US indices reaching their limits? Hormuz tensions have now entered their ninth week, adding pressure to inflation, central bank expectations, and the yield outlook.
Key events to watch:
- BOJ near-term intervention could support another bearish wave in USD/JPY below 154.80, while capping US indices gains amid carry trade unwind risks
- US employment, growth, and inflation data, with NFP scheduled for Friday
- Crude oil price risks: continuation above 115 or a pullback below 88 and 82
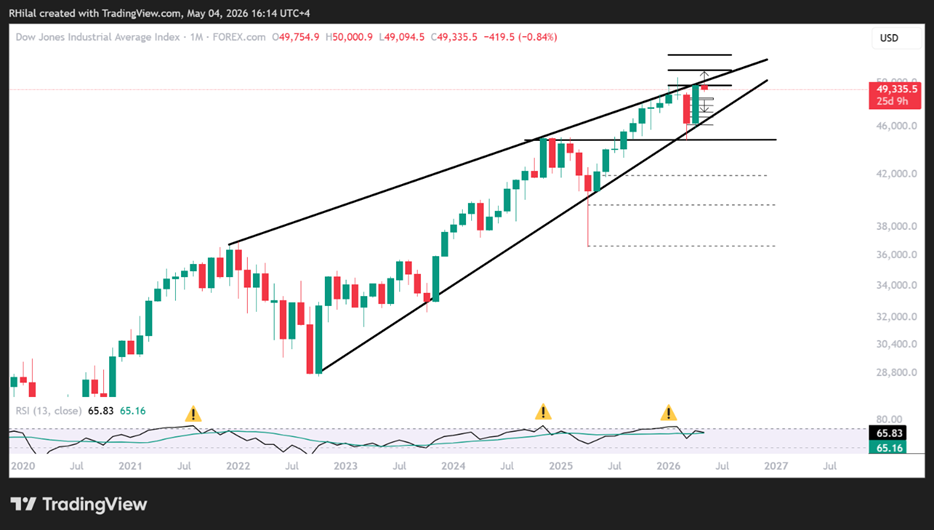
While these events help explain investor positioning, currently supported by positive earnings momentum, the extended rally warrants close attention to key resistance levels, particularly the four-year resistance on the Dow Jones chart, as Hormuz tensions extend to week 9.
Dow Jones Price Outlook: Monthly Time Frame – Log Scale

Source: Trading view
The Dow Jones chart signaled early caution for pullback risks at the beginning of the year, as gains tested a four-year resistance connecting consecutive highs since 2022, following the bullish rebound from 2020 and forming a potential diagonal pattern.
The Middle East conflict triggered a drawdown from 50,500 toward the lower bound of this consolidation and 2025 highs near 44800 , followed by a rebound back to the upper boundary, where prices are once again testing resistance. The key question remains: are we facing another sharp pullback, or a long-term bullish breakout?
Key levels in focus:
- A close above 49,900 and 50,500 would invalidate the bearish setup and extend gains toward 51,200 and 52,700 initially
- A close below 48,500 would increase downside pressure toward 47,800, 47,300, and 46,800, opening the door for either a rebound or deeper correction
Nasdaq Price Outlook: Weekly Time Frame – Log Scale
Source: Trading view
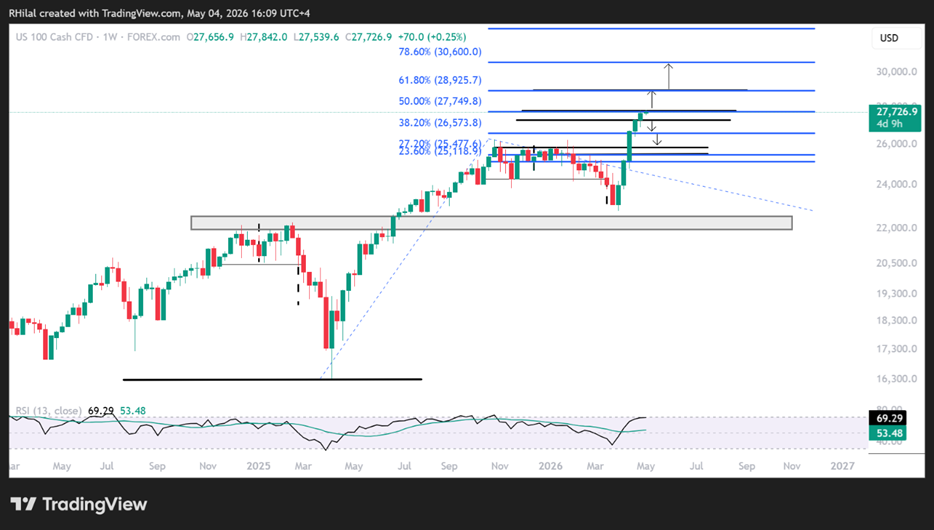
From a weekly perspective, Nasdaq momentum is showing signs of slowing near overbought levels, similar to prior peaks seen in 2024 and 2025. This raises the risk of a pullback or momentum unwind as markets realize the Q2 pressure from Hormuz-related risks over Q1 earnings.
Key levels to watch, derived using Fibonacci extensions between the April 2025 lows, October 2025 highs, and April 2026 lows, are:
27,800 (0.5)
28,900 (0.618)
30,660 (0.786)
On the downside, a break below 26,900 would reinforce a pullback toward 26,300, 26,100, and 25800, levels representing potential rebound opportunities, aligning with the consolidation zone extending between October 2025 and February 2026.
Written by Razan Hilal, CMT
Follow on X: @Rh_waves






