


EUR/USD and Nasdaq price action at these key levels reflects a market caught between improving geopolitical sentiment and persistent inflation concerns. This divergence is shaping positioning across both forex and equity markets.
The US dollar’s weakness—driven by BOJ intervention risks and potential carry trade unwinds—is supporting global currencies, including the euro. As a result, EUR/USD has rebounded toward the 1.18 resistance level, a critical zone that could either trigger a renewed pullback toward 1.16 or open the door to a bullish breakout toward multi-year highs above 1.1930.
However, a pause in BOJ intervention risks, combined with a renewed escalation in US–Middle East tensions, could restore dollar strength against the euro, especially as central banks maintain relatively hawkish rhetoric.
On the Nasdaq front, strong tech earnings continue to extend the bullish wave toward the 29,000–30,600 zone, with resistance levels being tested progressively. However, concerns around inflation and the sustainability of earnings remain key risks. NVIDIA earnings, expected later this month, along with upcoming US NFP and CPI indicators, could act as a major volatility catalyst for the index.
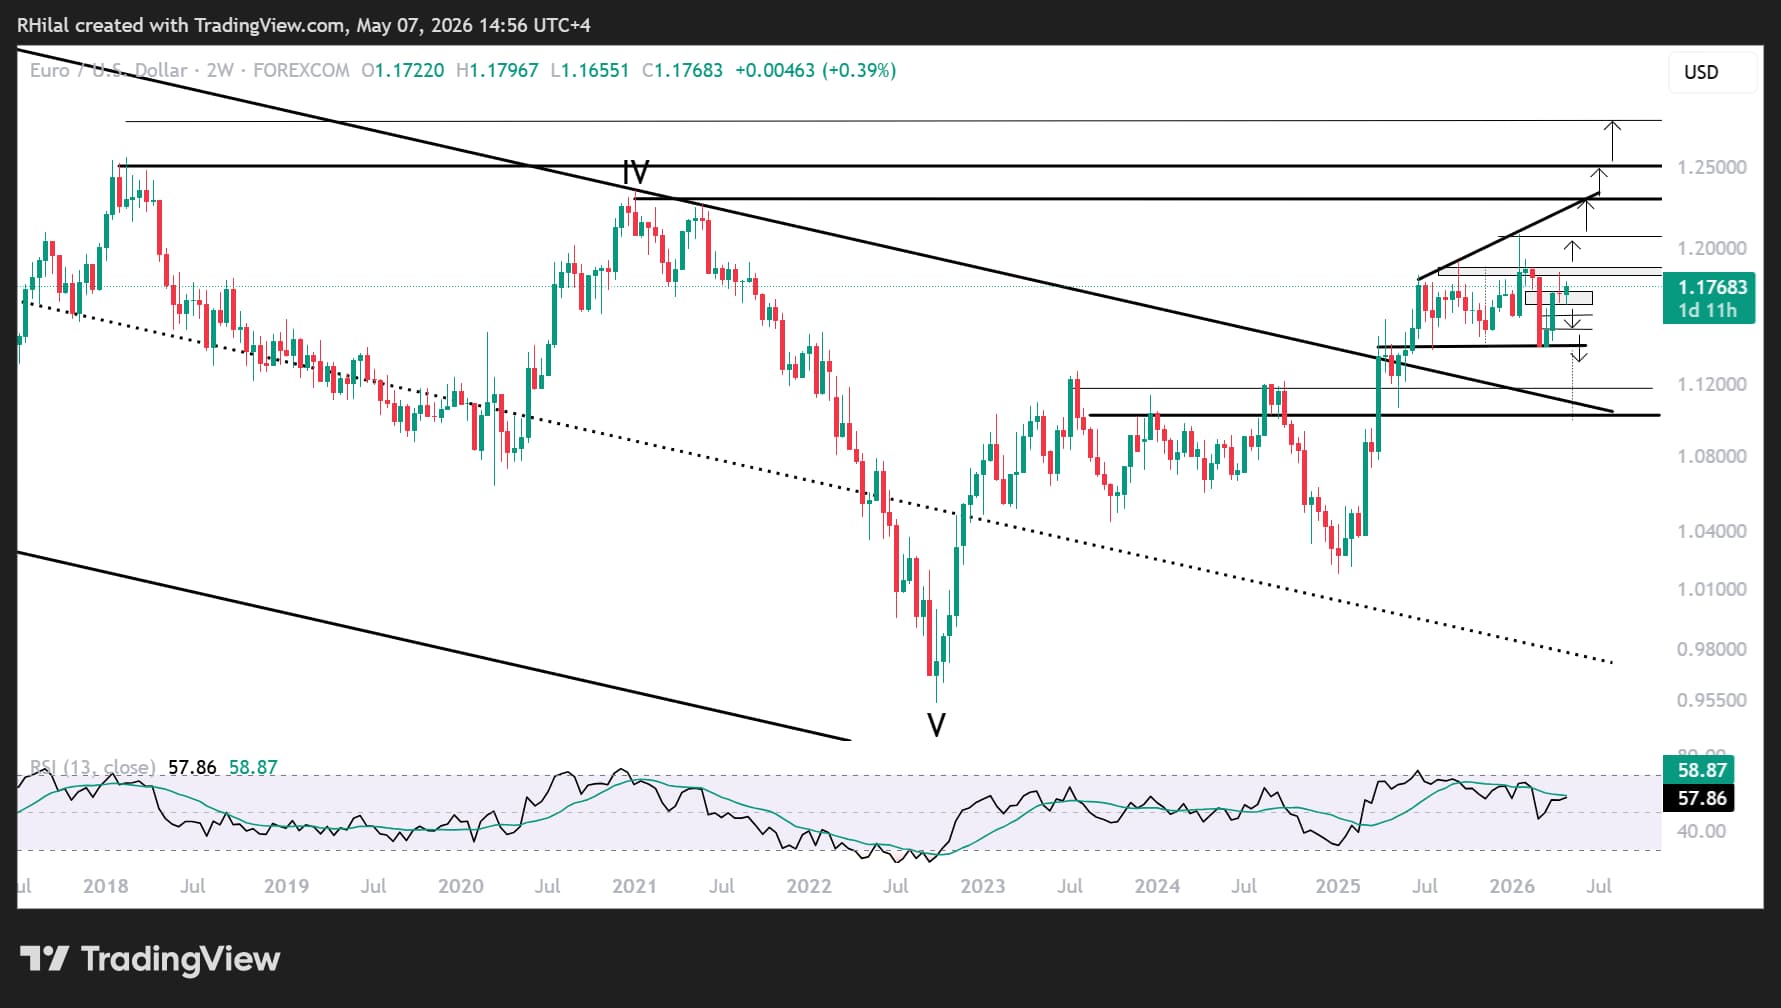
EUR/USD Outlook: 2-Week Time Frame (Log Scale)
Source: TradingView
In the short term, EUR/USD continues to trade within a consolidation range established since June 2023, capped below the 1.20 resistance zone and supported above 1.14.
Short-term bullish scenario: A sustained breakout above 1.18—aligned with the 100% Fibonacci extension of the wave spanning March 13, March 23, and March 30—could extend gains toward 1.1880, 1.1930, and 1.2080.
Long-term bullish scenario: A breakout above 1.2080 would align price action with the trendline connecting higher highs since June 2025, coinciding with the 2021 peak near 1.2300. This could confirm a broader bullish cycle toward 1.25 and 1.28.
Short-term bearish scenario: On the downside, a close below 1.1660 could trigger another pullback toward 1.1590, followed by 1.1520 and 1.14.
Long-term bearish scenario: A breakdown below 1.14 would increase downside risks toward the 1.10 zone, aligning with the upper boundary of the long-term descending channel spanning 2008 to 2025.
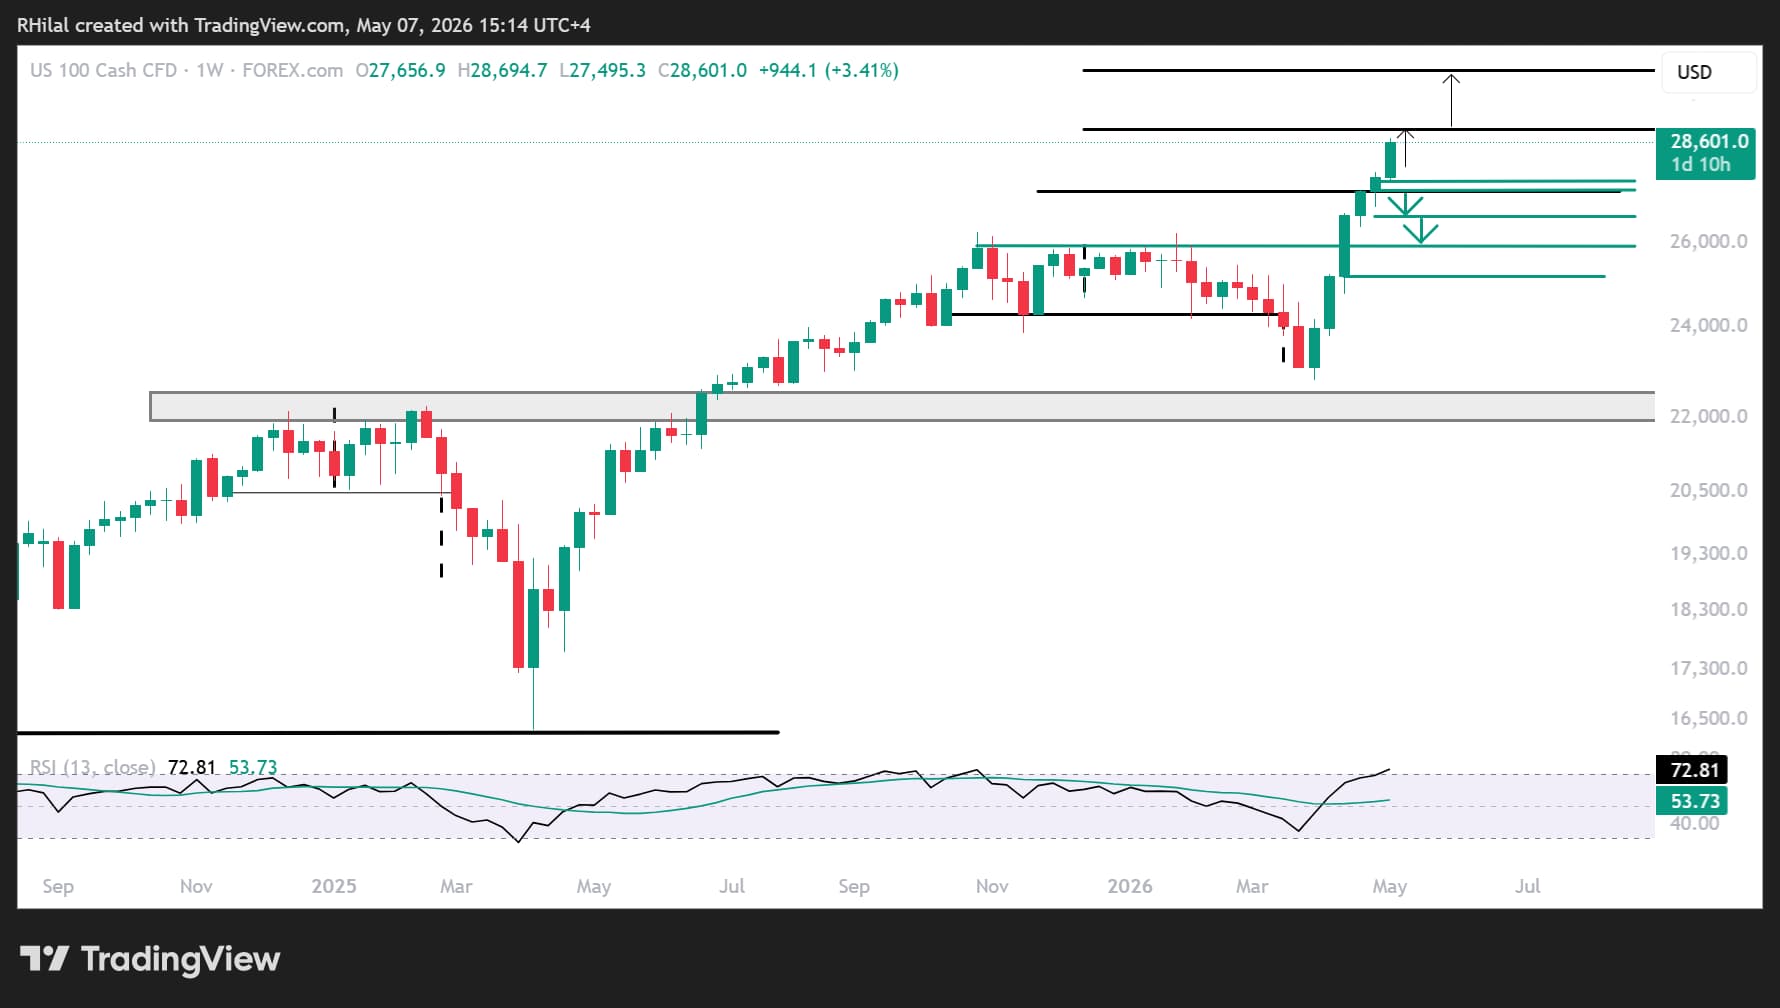
Nasdaq Price Outlook: Weekly Time Frame (Log Scale)
Source: TradingView
The Nasdaq trend continues to extend toward the 29,000 level, supported by short consolidation phases near Fibonacci extension levels derived from the wave between the April 2025 low (16,324), the 2025 high (26,257), and the 2026 low (22,783).
Momentum indicators, particularly the weekly RSI, suggest overextended conditions, reinforcing caution as the index approaches the 30,000 psychological level. This comes as the Dow Jones shows signs of stalling near 50,000, as discussed in my previous analysis, ahead of key US economic data releases, including Non-Farm Payrolls (NFP) and CPI.
Bullish scenario: A sustained close above 28,900 (61.8% Fibonacci extension) could extend gains toward 30,600 (78.6%).
Bearish scenario: A break below 27,500 and 27,200 would increase downside risks toward 26,600 and 25,800, respectively—levels that align with previous highs from 2025–2026 and may offer potential support for a bullish rebound.
Final Thoughts
While market sentiment continues to shift with geopolitical developments and macroeconomic data, price action remains the most reliable indicator of underlying market positioning.
In both EUR/USD and the Nasdaq, reactions around the 1.18 and 29,000 levels will be critical in defining the next directional move—whether through continued bullish momentum or a corrective phase driven by inflation risks and shifting central bank expectations.
Written by Razan Hilal, CMT
Follow on X: @Rh_waves






