- EUR/USD forecast: Energy risks and Fed repricing dominate near-term direction
- ADP payrolls and ISM Services PMI coming up
- Sub-1.1500 cannot be ruled out, especially if the energy shock deepens
The FX market staged a subtle shift in tone this morning. After the dramatic moves driven by surging energy prices, we’ve seen a partial unwind as investors trim long dollar and short equity bets. A modest risk-on flicker emerged after a New York Times report suggested Iran had indirectly approached the CIA about potential terms to end the war. That followed comments from US President Donald Trump that the navy would protect shipping in the Middle East, and that Washington would offer risk insurance to ensure the “free flow of energy to the world”. It all sounds reassuring on paper. Yet, the reality is that the conflict continues, and there is no tangible sign of de-escalation yet. Against this backdrop, our EUR/USD forecast remains cautions with risks still tilted to the downside.
EUR/USD forecast dented by energy shock
Up until today, FX price action was almost entirely about how high energy prices favour exporters and punish importers. That left the euro exposed, especially as volatility triggered a wave of deleveraging in other assets classes too. Still, unless we see a meaningful improvement in the energy narrative – either through lower oil prices or concrete steps to reopen Hormuz – it’s hard to make a compelling case for rebuilding structural short dollar positions. For around a fifth of global oil and gas flows through the Strait of Hormuz, and traffic has all but stalled following Iran’s threats against vessels. Markets, understandably, want more than rhetoric before dialling down the risk premium in energy.
Will the Fed deliver any rate cuts at all?
The inflationary implications of higher energy prices have already prompted a hawkish repricing at the short end of the US yield curve. Sticky price pressures could limit the Fed’s room to cut, especially if we also see further improvement in US data. Markets currently price around 45 basis points of easing this year. That could be pared back further if this week’s employment indicators top forecasts. Today’s focus is on ADP employment report, where a print of around +50k is expected. Anything higher would reinforce the idea that downside risks to the labour market have diminished. Attention will then turn to the ISM services survey, particularly the prices paid component later on today. A high reading there would bolster the argument that inflation remains uncomfortably firm.
EUR/USD forecast: Is 1.1500 the floor?
Given that asset managers had built sizeable long exposure on the EUR/USD previously, the sort of volatility spike we’ve just witnessed means the pair remains vulnerable for further downside. The key question for this EUR/USD forecast is duration. If the energy shock proves persistent and Hormuz remains effectively shut, a deeper move towards the low $1.10s cannot be ruled out.
However, if over the coming week shipping lanes gradually reopen, the worst of the energy panic could subside. In that scenario, 1.1500 may well prove to be the lower boundary of the current range. For today, barring fresh negative headlines, conditions already look marginally calmer. That could allow the EUR/USD to stabilise a little, but the chart still looks fairly bearish, despite the recovery we’ve seen since yesterday afternoon.
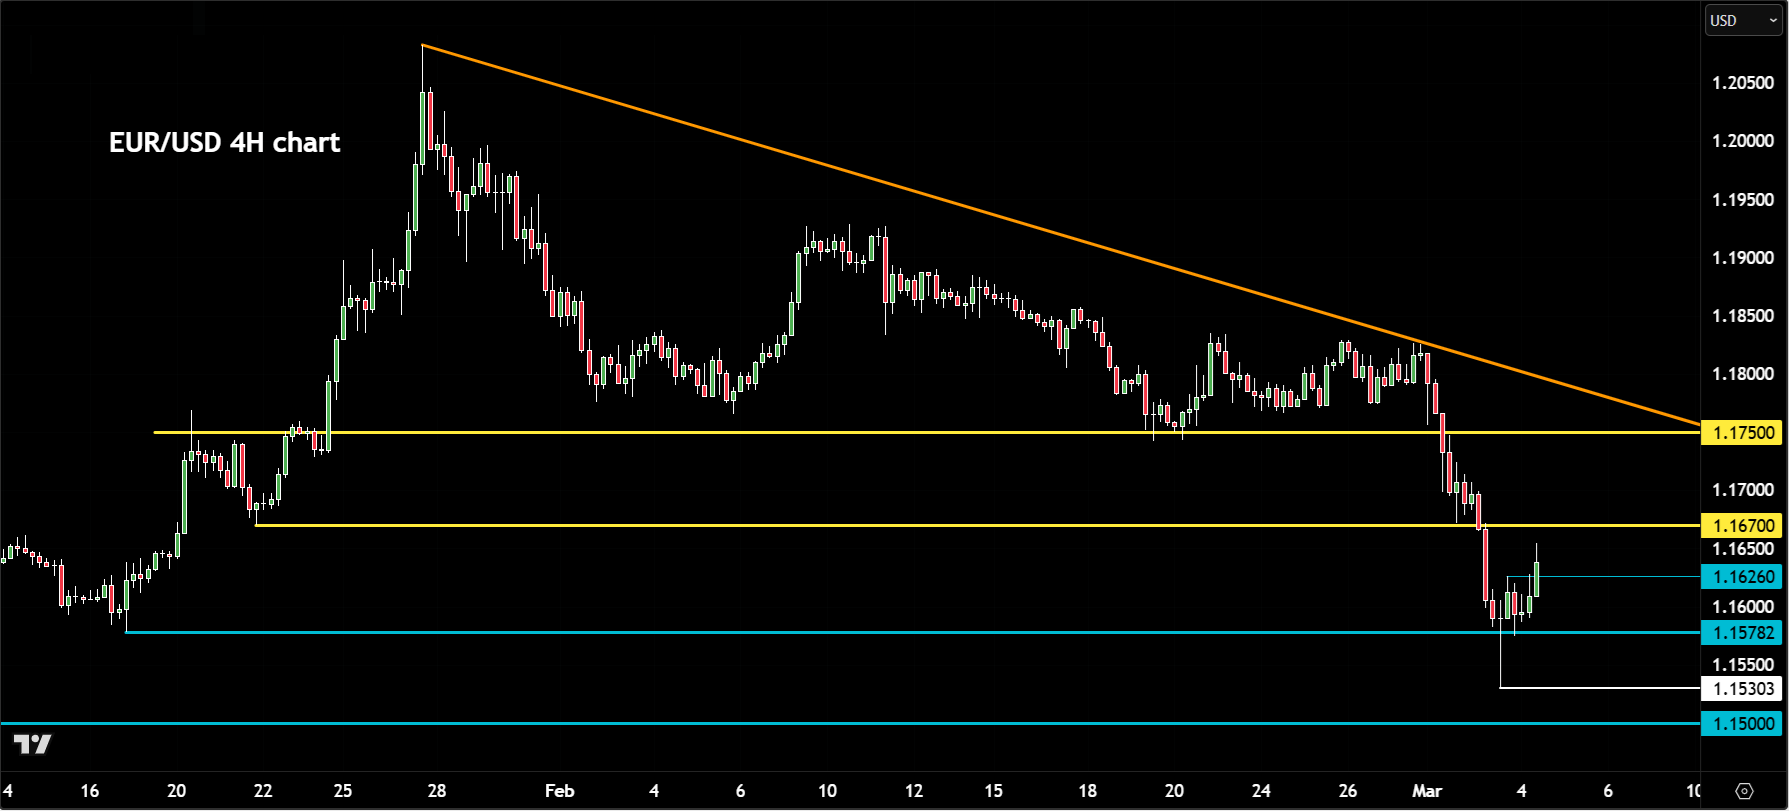
On the four-hour chart, the EUR/USD printed a doji candle right around the January low at 1.1578. That does carry a mildly bullish tone, as it hints at a potential false breakdown scenario.
However, stepping back, the broader structure remains intact: we’re still seeing a pattern of lower highs and lower lows. Key resistance levels have not been taken out. In particular, the 1.1670 area is now the most important resistance to watch. As long as that continues to cap the upside, the risks remain tilted to the downside from a technical perspective.
If the EUR/USD manages to break above 1.1670, that would be an encouraging short-term signal. A move through that level could open the door towards 1.1700 initially, and then 1.1750, where the descending resistance trend line also comes into play. That’s where sellers may look to reassert control.
But given the directional bias from the daily time frame, the underlying trend is clearly still bearish. So, let’s concentrate more on the downside levels. Here, initial support is now seen around 1.1625, marking the highs of the prior 4H candles. Below that you have that January low at 1.1578. A decisive break below that would likely expose the 1.1500 handle and reinforce the broader bearish trend.

-- Written by Fawad Razaqzada, Market Analyst
Follow Fawad on Twitter @Trader_F_R