
The US dollar and Treasury yields continue climbing toward fresh yearly highs, pressuring both the euro and gold as markets start to price in risk-off sentiment driven by rising inflation and profit-taking across technology-led rallies.
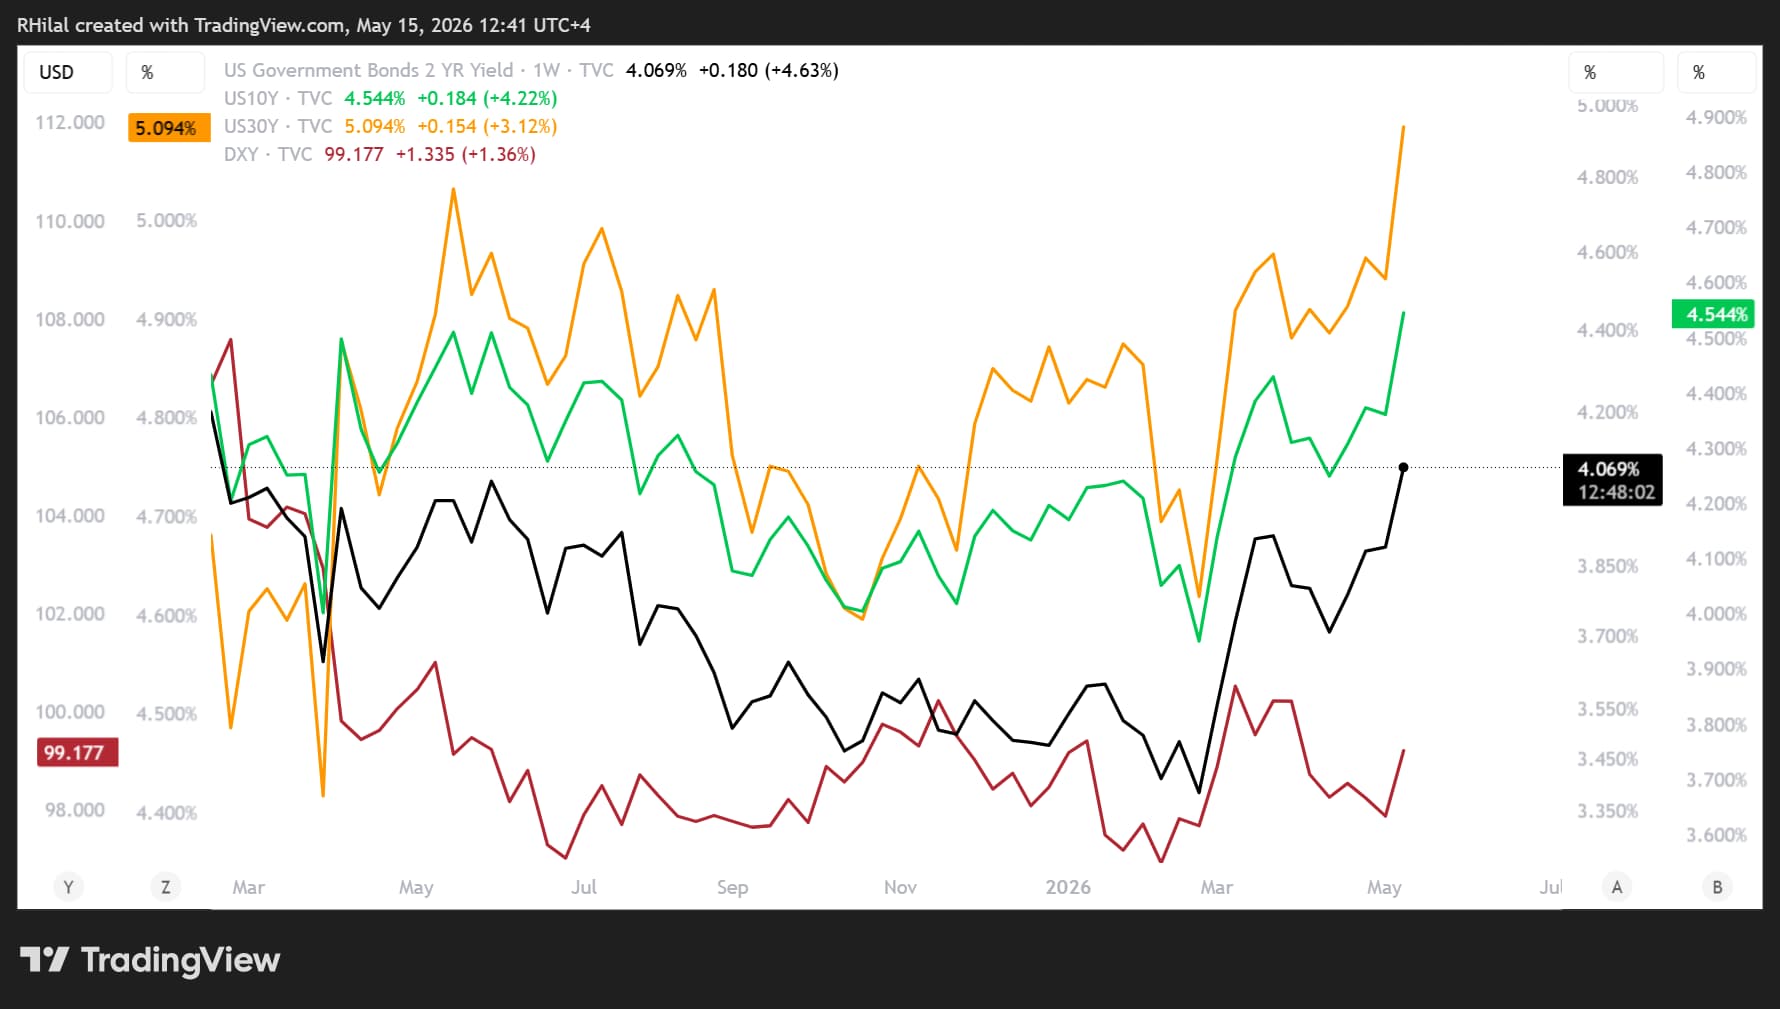
US Bond Yields: 2Y – 10Y – 30Y, DXY Weekly Chart – Log Scale
Source: TradingView
Recent market movements continue to reinforce the bullish rebound in the US dollar and Treasury yields:
- DXY climbed back above 99
- US bond yields recorded fresh yearly highs:
- US 2Y > 4.05%
- US 10Y > 4.5%
- US 30Y > 5%
This rebound aligns with rising global inflation pressures fueled by prolonged strength in energy markets and geopolitical risks.
Key inflation figures include:
- Chinese PPI at 2.8%, near 4-year highs
- US CPI at 3.8%, near 3-year highs
- US PPI at 1.4%, near 4-year highs
The inflation and yield narrative has continued pressuring gold below the 4800 resistance zone despite silver’s rally toward the psychologically important 90 level and a major multi-month resistance area.
Silver’s price action may be signaling the final phase of its outperformance before a broader metals pullback alongside gold, as discussed in the article: Silver Price Outlook: Lagging or Leading Gold?
Meanwhile, EUR/USD continues tracing the inverse relationship with the US dollar index, extending its downside move as defensive positioning builds across global markets.
Recent price action includes:
- Gold falling toward the 4500 support zone and the March–April downtrend
- EUR/USD declining toward 1.1630
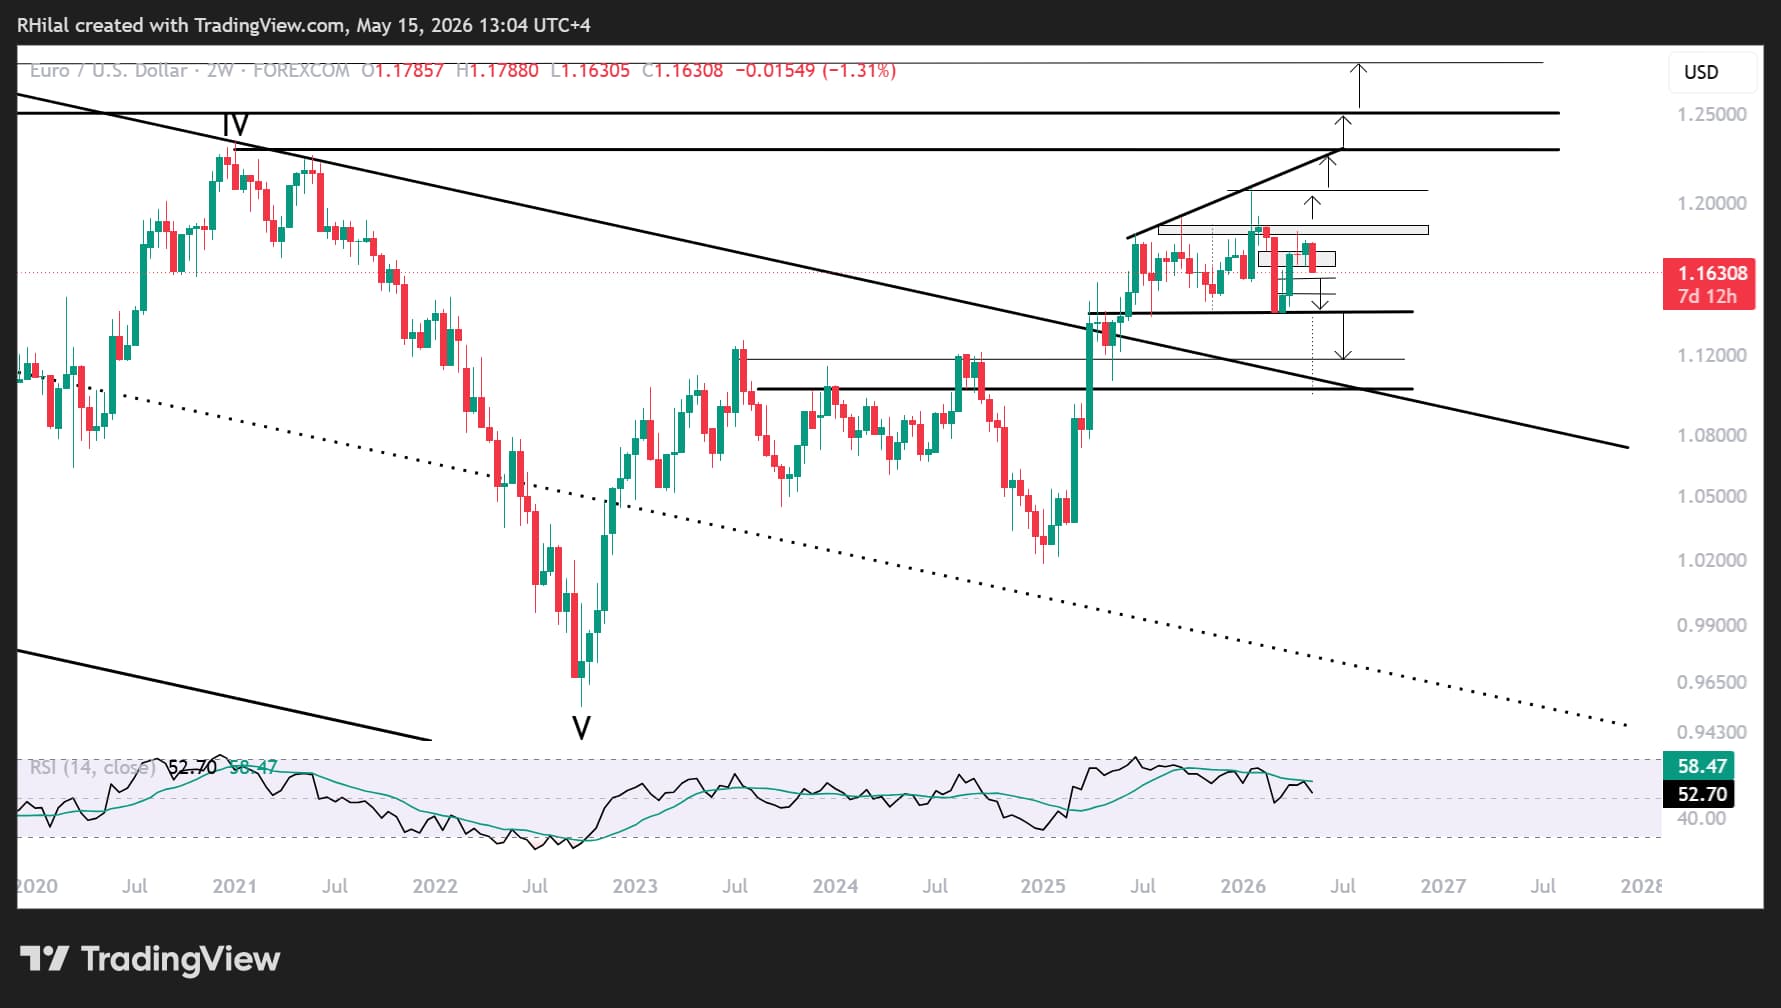
EUR/USD Price Outlook: Weekly Time Frame – Log Scale
Source: TradingView
EUR/USD continues trading within a broad consolidation range established since June 2023, capped below the 1.20 resistance zone while remaining supported above 1.14.
Short-Term Bearish Scenario
A close below 1.1660 could trigger another corrective move toward previously respected support levels 1.1590 - 1.1520 - 1.1400
Long-Term Bearish Scenario
A breakdown below 1.14 would increase downside risks toward the 1.10 zone, aligning with the upper boundary of the long-term descending channel extending from 2008 to 2025.
Short-Term Bullish Scenario
A sustained breakout above 1.18, aligned with the 100% Fibonacci extension of the March 13–March 23–March 30 wave structure, could extend gains toward: 1.1880 - 1.1930 - 1.2080
Long-Term Bullish Scenario
A breakout above 1.2080 would align price action with the trendline connecting higher highs since June 2025 while approaching the 2021 peak near 1.2300.
Such a move could confirm a broader bullish cycle targeting:
- 1.25
- 1.28
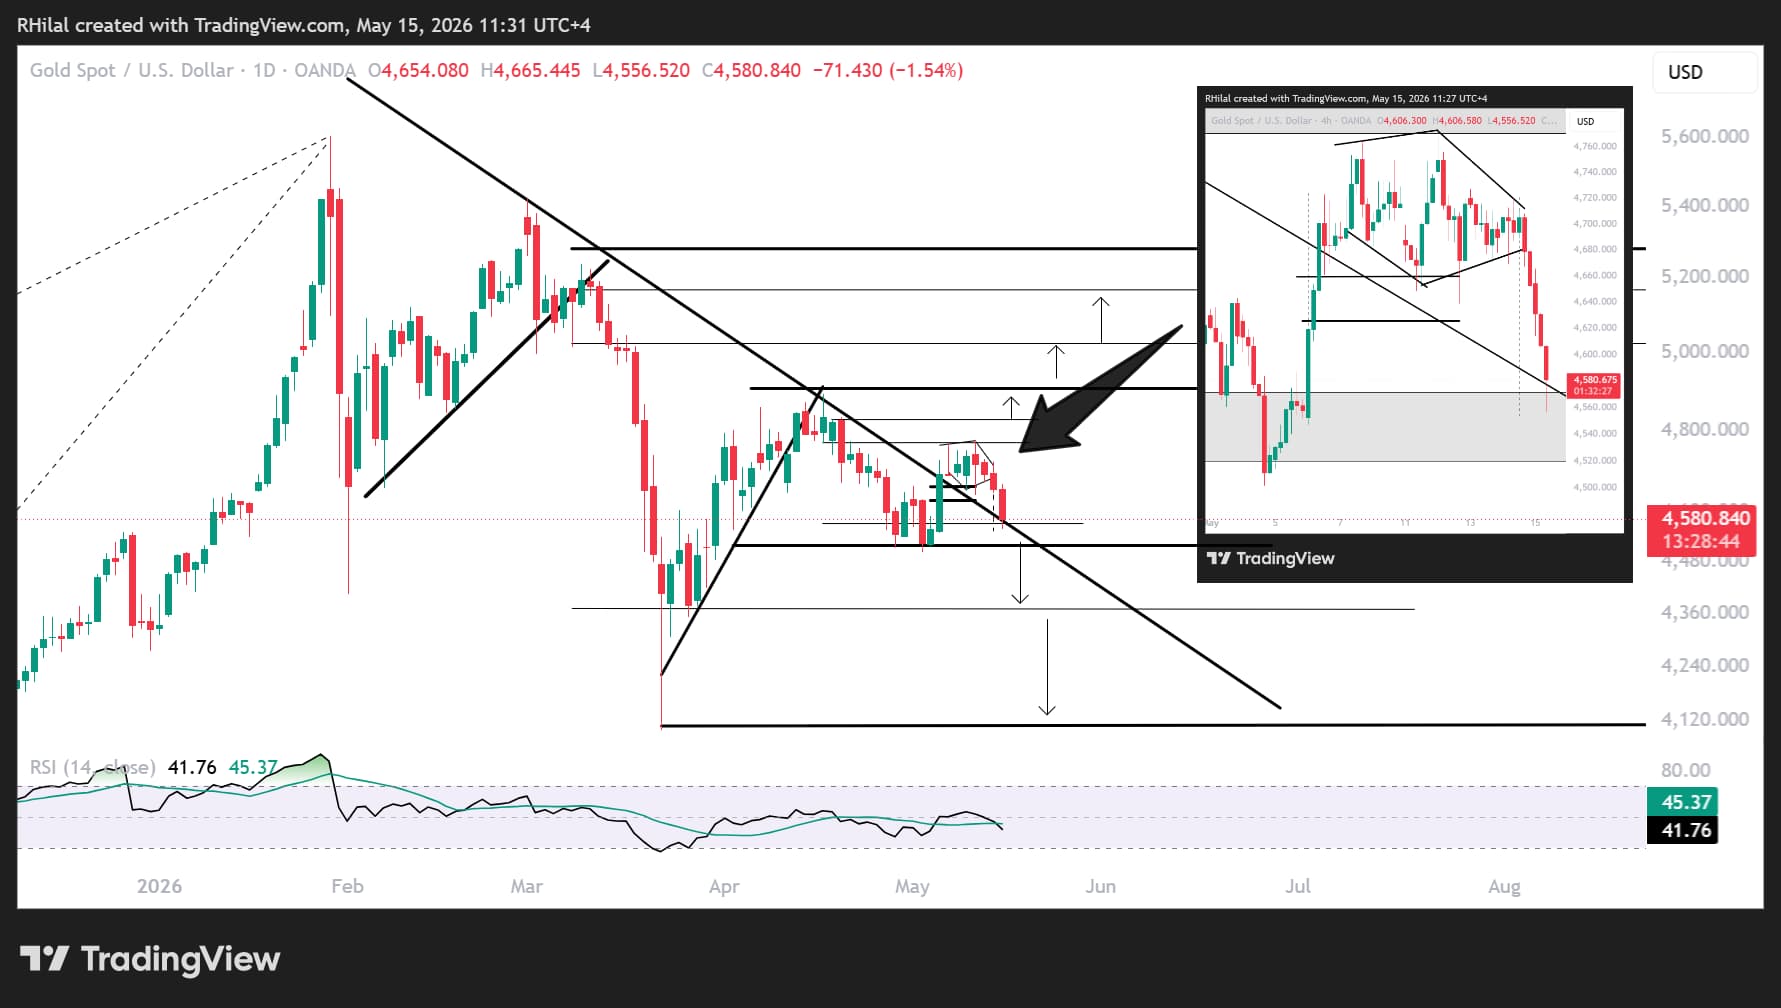
Gold Price Outlook: Daily Time Frame – Log Scale
Source: TradingView
Combining the daily and 4-hour time frames highlights the emergence of a classic diamond reversal pattern beneath the 4800 resistance zone.
The pattern triggered a sharp decline that is now retesting the descending trendline connecting lower highs between March and April 2026.
Short-Term Bullish Scenario
Holding above the trendline and the 4500-4550 support zone could allow gold to revisit the:
- 4600–4650 resistance zone
A successful recovery could later reopen the path toward the broader resistance area between:
- 4720
- 4780 ( reversal pattern high)
Long-Term Bullish Scenario
A sustained close above 4780 could extend gains toward:
- 4890 (April 2026 high)
- 5000 ( psychological zone )
- 5250
Such a breakout would confirm the continuation of the long-term bull cycle toward fresh record highs.
Bearish Scenario
A close below 4500 could extend losses toward key yearly support zones between:
- 4370
- 4080 (yearly low)
These levels may either trigger another bullish rebound or expose gold to a deeper breakdown toward the 3800 region.
As bond yields and inflation expectations continue rising, gold and major currencies remain vulnerable against the strengthening US dollar.
Markets are increasingly transitioning toward defensive positioning, while elevated yields and persistent inflation pressures continue challenging the bullish momentum across metals and currencies.
Written by Razan Hilal, CMT
Follow on X: @Rh_waves