


For much of Q4 it looked like EUR/USD bears would be able to run a break, but that 1.1500 level came in as strong support on multiple occasions until, eventually, a run of USD-weakness took back over in December. But, like we saw on a few different occasions last year, EUR/USD bulls couldn’t make much ground above the Fibonacci resistance plotted from 1.1686-1.1748, and that zone has again held buyers at bay as prices have started to retrace last month’s rally.
EUR/USD Weekly Chart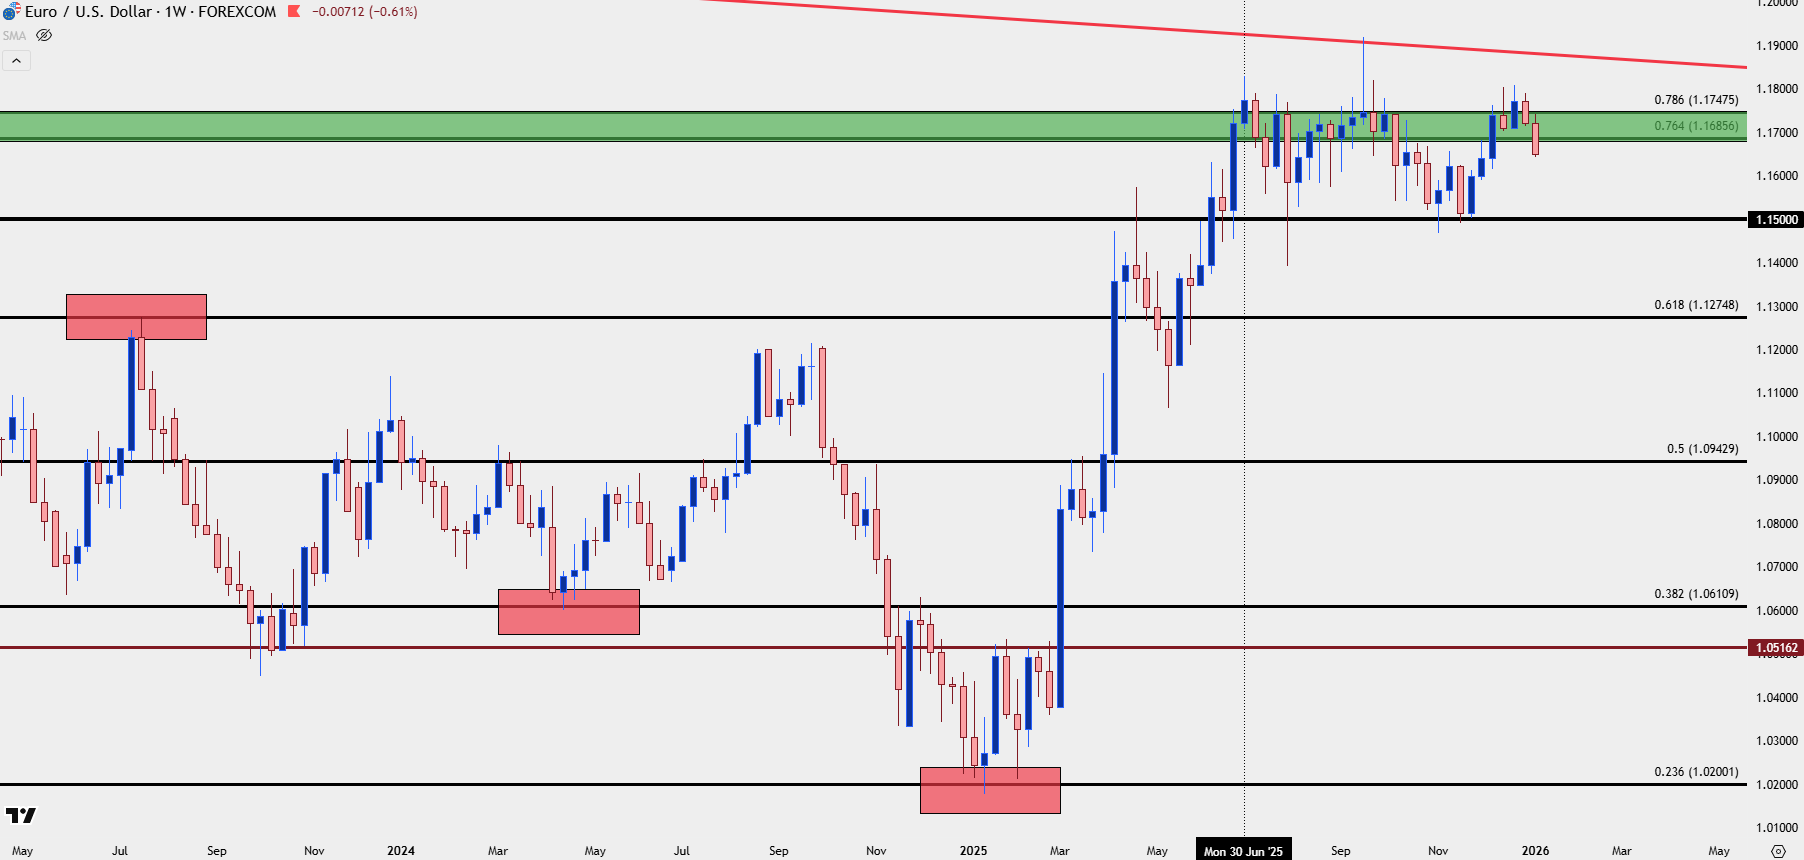
Chart prepared by James Stanley; data derived from Tradingview
EUR/USD and the DXY, an Order of Balance
Because the Euro is a whopping 57.6% of the DXY basket, it’s difficult for one market to trend without at least some participation from the other, and last year is a great example of that and perhaps even earlier, drawing back to the middle of 2024.
As markets warmed to the idea of FOMC rate cuts, USD/JPY was smashed and USD-weakness showed visibly in EUR/USD as the pair jumped up for a test of the 1.1200 handle, even without a strong fundamental backdrop in the Euro-zone at the time. When the Fed first cut rates in September of 2024, that resistance held until a reversal developed in Q4 of that year.
And as we came into 2025 it seemed almost a foregone conclusion that EUR/USD would test parity, but that never came to pass as the pair set its yearly low less than two weeks into 2025 and then spent the next few months in another reversal pattern, eventually finding resistance around the 1.1700 handle.

Making matters more interesting is a Fibonacci retracement that’s defined much of the technical backdrop over that time. The 2021-2022 major move offered a support level at 1.0200 that came into play in January of last year, ultimately holding the low before buyers built an ascending triangle in February and a breakout in March. And then April, May and June led to that strong trend, all the way until resistance showed at the 76.4 and 78.6% Fibonacci retracements.
EUR/USD Daily Chart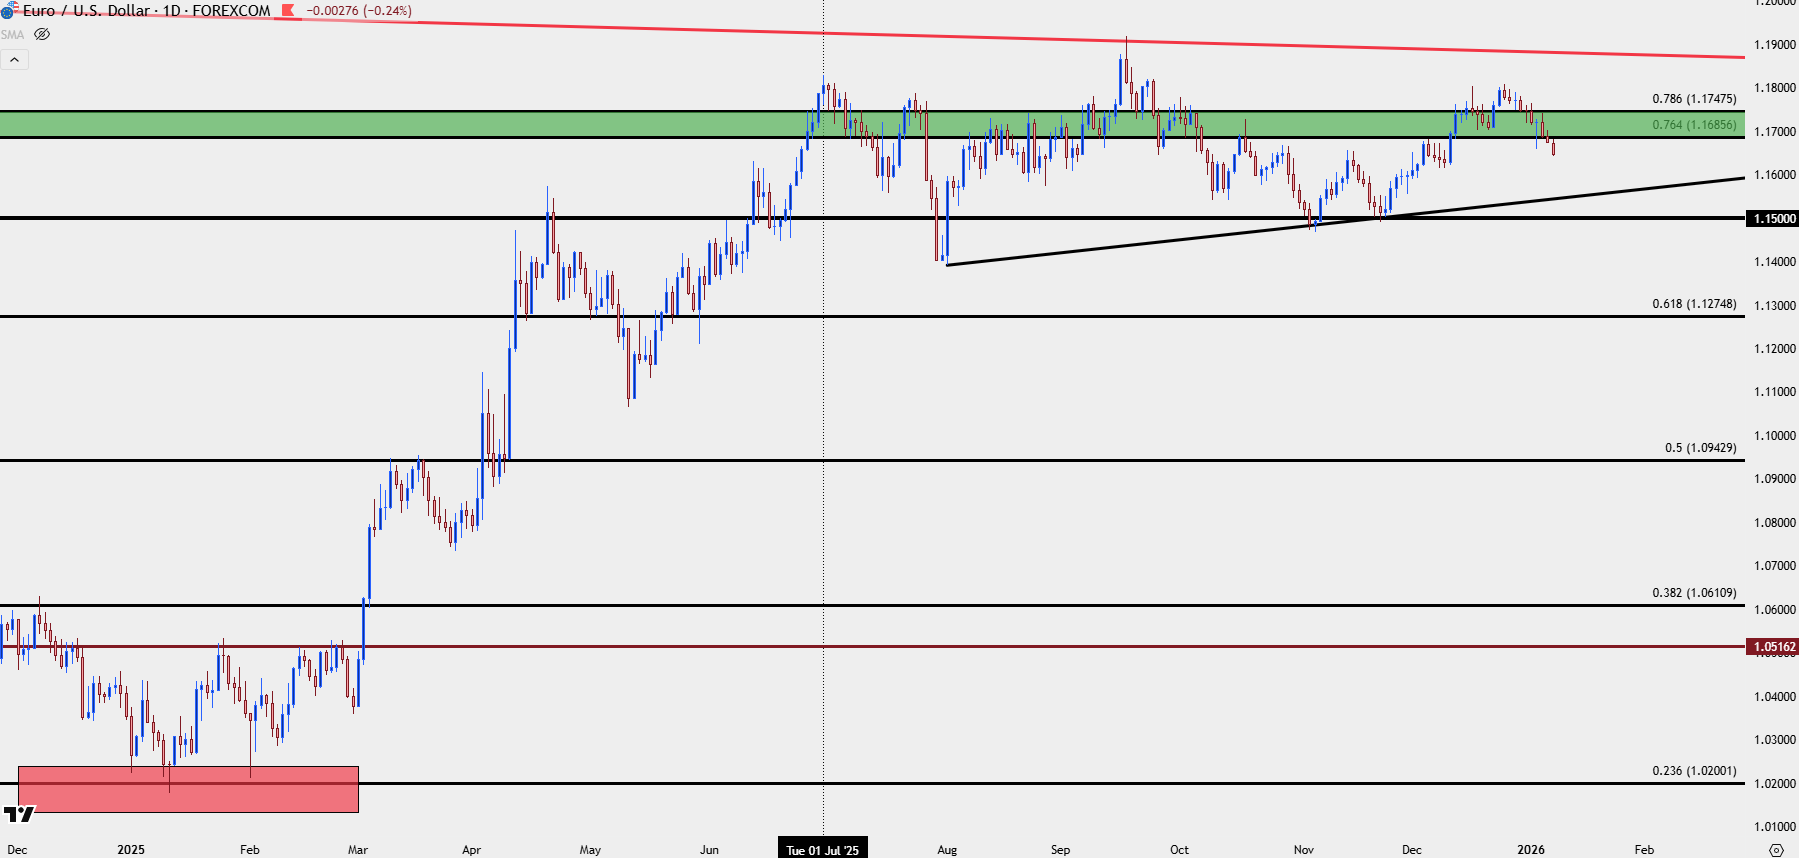
Chart prepared by James Stanley; data derived from Tradingview
EUR/USD Bears Begin to Push
The point of the history lesson above is to highlight a couple of key facts. First and foremost, reversals can happen especially around quarterly and especially yearly cut-offs. Last year we saw this twice, both two weeks into the New Year when the sell-off stalled and then right around the open of Q3 when the rally stopped and the grinding began. But, perhaps more importantly, the Euro’s outsized 57.6% allocation in the DXY basket means that for either market to trend we’ll probably need a bit of help from both, and tomorrow’s US NFP report brings that potential.
At this point, from the four-hour chart, we have lower-lows and highs and this is something that could potentially lead in to the build of bearish structure. Like I looked at multiple times last quarter, that 1.1500 level is huge, and it rarely gives way on the first test and now a couple months later, we can see how that visibly played out. But – that 1.1500 spot becomes another key area for bulls to test if they can continue the trend.
For now – resistance potential exists at that 76.4% Fibonacci retracement, plotted at 1.1686. And even tighter is a zone of recent support taken from prior resistance, spanning from 1.1656-1.1669. For next supports, there was a significant swing low at 1.1616 but that really looked to be an element of defense above a bigger zone of resistance-turned-support from 1.1593-1.1600, and there’s’ another possible support area from 1.1542-1.1550 which is then followed by the big figure of 1.1500.
EUR/USD Four-Hour Chart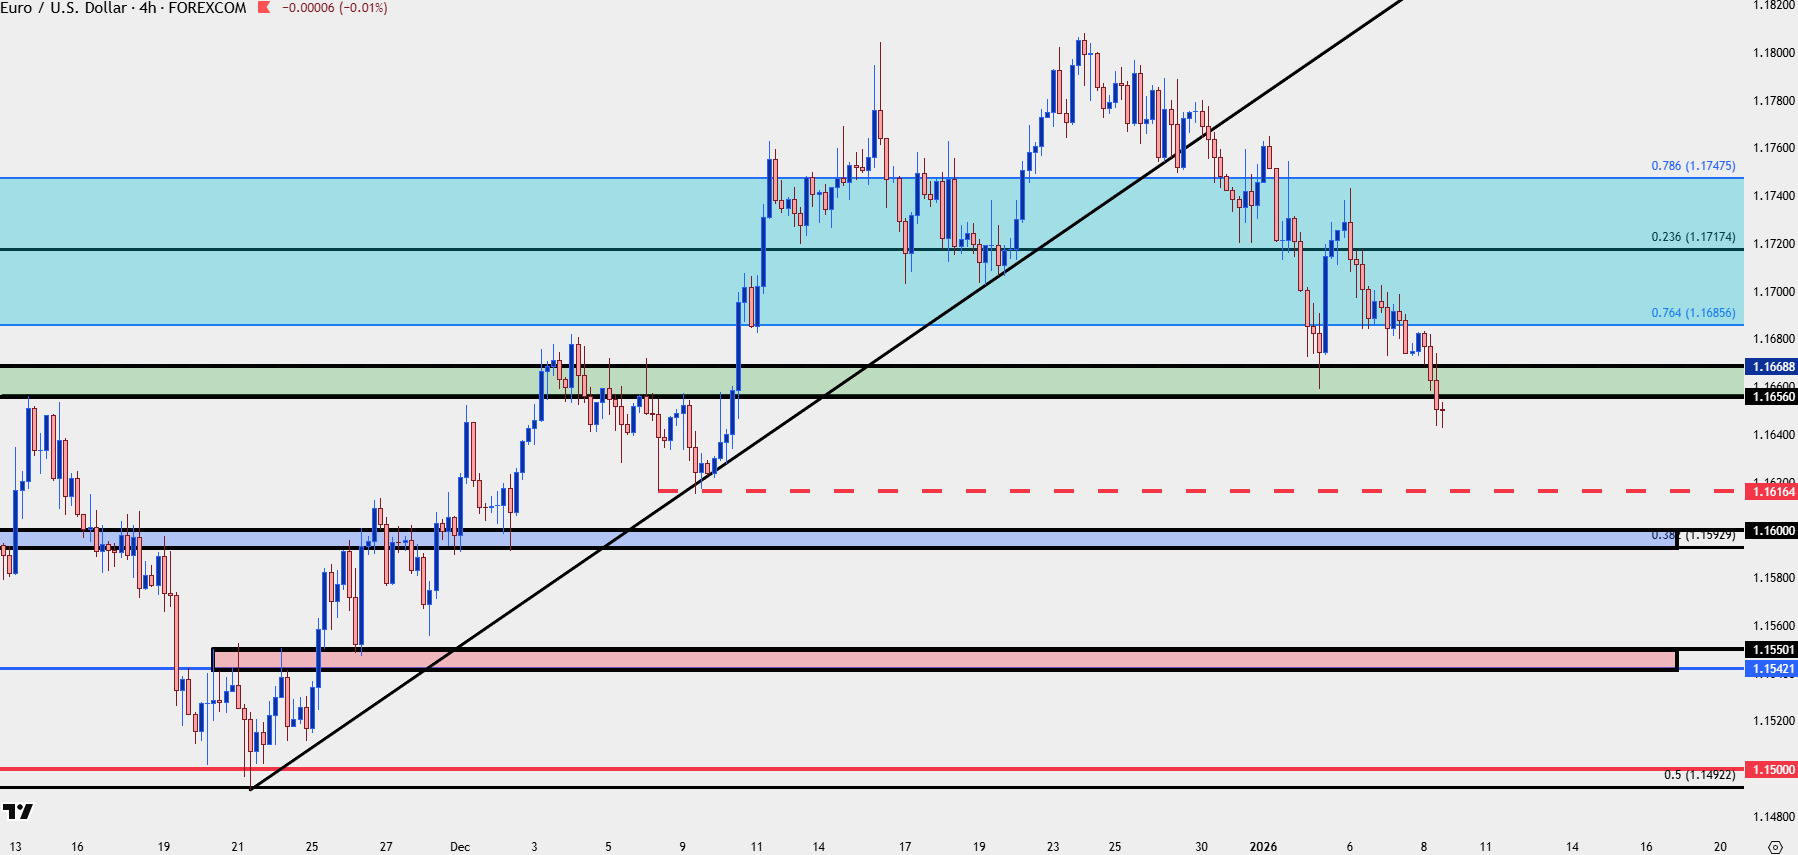
Chart prepared by James Stanley; data derived from Tradingview
--- written by James Stanley, Senior Market Analyst, Global Macro






