



Euro Forecast: EUR/USD Bounces Despite Soft PMIs - Could We Re-Test 2-Month Highs?
EUR/USD is showing resilience, bouncing despite a slowdown in this morning’s Eurozone PMI survey - can it rally back to 2-month highs at 1.1830?
Share this:

EUR/USD Key Points
- The US-Iran conflict continues to simmer in the background, despite waning interest on the part of traders.
- EUR/USD is showing resilience, bouncing despite a slowdown in this morning’s Eurozone PMI survey.
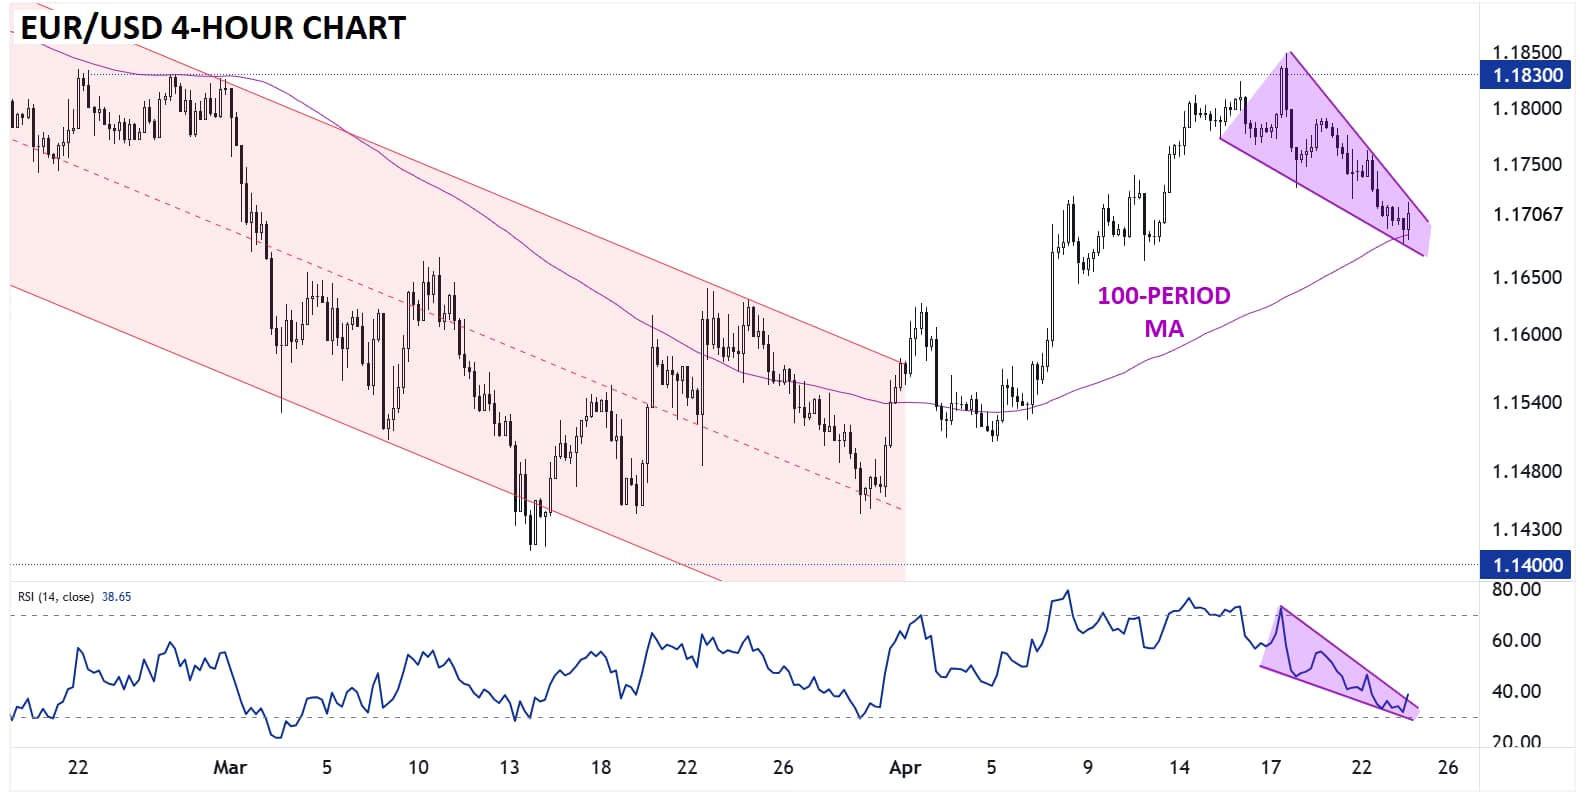
- A breakout from EUR/USD’s falling wedge pattern would increase the odds of a continuation back toward 2-month highs near 1.1830
Markets are once again on tenterhooks awaiting new developments in the US-Iran stalemate, with neither side willing to commit to talks or escalate military actions. While fresh developments are possible, even likely, heading into the weekend, it’s clear that general interest in the war is waning:

Source: Google Trends
Against that backdrop, traders are keeping at least one eye on economic data, which is painting a mixed picture of the fallout from the conflict. While today’s UK PMI surveys were generally better than expected, the same cannot be said for the Eurozone, where Services PMI came in at 47.4, below the 49.8 reading expected. Even after a decent 52.2 reading in Manufacturing PMI, the composite PMI for the Eurozone remained in contractionary territory at 48.6.
As some readers may know, PMI surveys are among the most timely readings on current economic conditions, and today’s readings suggest that the Eurozone economy is stagnating at best as it navigates rising input price inflation, a development that could also push the ECB to raise interest rates later this year.


Euro Technical Analysis: EUR/USD 4-Hour Chart
Source: Tradingview, StoneX
Despite the subdued PMI print, the euro is holding up relatively well against the world’s reserve currency. As the 4-hour chart below shows, the world’s most widely-traded currency pair is seeing a small bounce today after testing its 100-period (400-hour) MA. More broadly, EUR/USD is carving out a falling wedge pattern over the past week, which is generally seen as a bullish pattern despite the name. A similar pattern on the 14-period RSI can be monitored for a potential leading sign of a bullish resumption.
A break out above the top trend line would increase the odds of a continuation back toward 2-month highs near 1.1830 as we head into next week, though a break below the 400-hour MA would call the pattern into question.
-- Written by Matt Weller, Global Head of Research
Check out Matt’s Daily Market Update videos on YouTube and be sure to follow Matt on Twitter: @MWellerFX


Open an account in minutes
Experience award-winning platforms with fast and secure execution.
Economic calendar
Web Trader platform
Our sophisticated web-based platform is packed with features.
Related articles
Gold coils for potential breakout as US CPI looms
Gold's ascending triangle is putting $4,140 firmly in focus ahead of US CPI. With traditional macro relationships offering few clues, the price action may prove more useful for traders.

USD/CAD Outlook: Loonie left behind as US CPI looms
USD/CAD's sharp rebound has coincided with widening US–Canada interest rate differentials. With US CPI approaching and bullish momentum building, another breakout may be on the cards.

Japanese Yen Outlook: EUR/JPY and GBP/JPY Outbid USD/JPY
The Japanese yen starts the week mixed, with EUR/JPY and GBP/JPY showing bullish potential while USD/JPY remains stuck in a rut.

The information on this web site is not targeted at the general public of any particular country. It is not intended for distribution to residents in any country where such distribution or use would contravene any local law or regulatory requirement. The information and opinions in this report are for general information use only and are not intended as an offer or solicitation with respect to the purchase or sale of any currency or CFD contract. All opinions and information contained in this report are subject to change without notice. This report has been prepared without regard to the specific investment objectives, financial situation and needs of any particular recipient. Any references to historical price movements or levels is informational based on our analysis and we do not represent or warranty that any such movements or levels are likely to reoccur in the future. While the information contained herein was obtained from sources believed to be reliable, author does not guarantee its accuracy or completeness, nor does author assume any liability for any direct, indirect or consequential loss that may result from the reliance by any person upon any such information or opinions.
Futures, Options on Futures, Foreign Exchange and other leveraged products involves significant risk of loss and is not suitable for all investors. Losses can exceed your deposits. Increasing leverage increases risk. Spot Gold and Silver contracts are not subject to regulation under the U.S. Commodity Exchange Act. Contracts for Difference (CFDs) are not available for US residents. Before deciding to trade forex, commodity futures, or digital assets, you should carefully consider your financial objectives, level of experience and risk appetite. Any opinions, news, research, analyses, prices or other information contained herein is intended as general information about the subject matter covered and is provided with the understanding that we do not provide any investment, legal, or tax advice. You should consult with appropriate counsel or other advisors on all investment, legal, or tax matters. References to FOREX.com or GAIN Capital refer to StoneX Group Inc. and its subsidiaries. Please read Characteristics and Risks of Standardized Options.