



European Open: Evergrande Coughs Up, Flash PMI’s in Focus
Another day, another bullet dodged by the troubled Property Developer Evergrande. With a slight risk-on tone, focus now shifts to Flash PMI data for Europe and the US.
Share this:

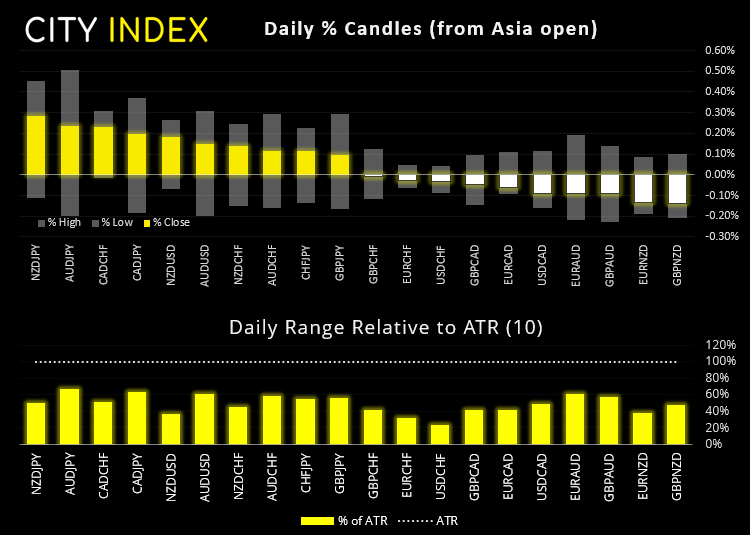
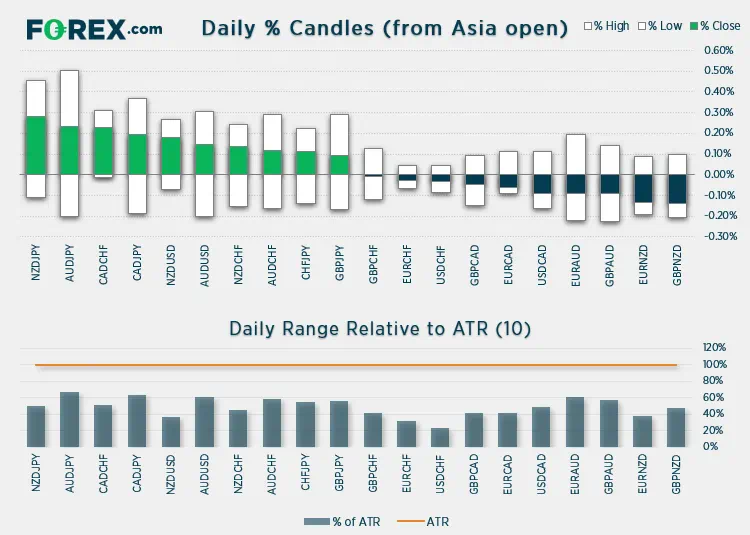
Asian Indices:
- Australia's ASX 200 index rose by 3 points (0.04%) and currently trades at 7,418.40
- Japan's Nikkei 225 index has risen by 112.15 points (0.39%) and currently trades at 28,822.41
- Hong Kong's Hang Seng index has risen by 115.37 points (0.44%) and currently trades at 26,132.90
UK and Europe:
- UK's FTSE 100 futures are currently up 25 points (0.35%), the cash market is currently estimated to open at 7,215.30
- Euro STOXX 50 futures are currently up 22 points (0.53%), the cash market is currently estimated to open at 4,177.73
- Germany's DAX futures are currently up 48 points (0.31%), the cash market is currently estimated to open at 15,520.56
US Futures:
- DJI futures are currently down -6.26 points (-0.02%)
- S&P 500 futures are currently down -75.75 points (-0.49%)
- Nasdaq 100 futures are currently down -4.75 points (-0.1%)
Learn how to trade indices
Indices
Evergrande averted another default by transferring funds for a dollar bond, according to a Reuters source. The $83.5 million payment to a trustee account was first reported by a state-backed new outlet earlier today. Whilst this provides relief for some investors the story is far from over with so many ‘known debts’ in the pipeline, alongside however many unknown ‘off balance sheet’ debts lurking in the system for Evergrande and the many Chinese property firms familiar with such practices.
Chinese equity markets led the way higher, although outside of China gains were light. China A50 is on track for a bullish outside week, with the daily chart showing increased bullish momentum. It’s one to watch next week for a break above 16,400, although it may cap as resistance initially due to the 200-day eMA and historical resistance level.
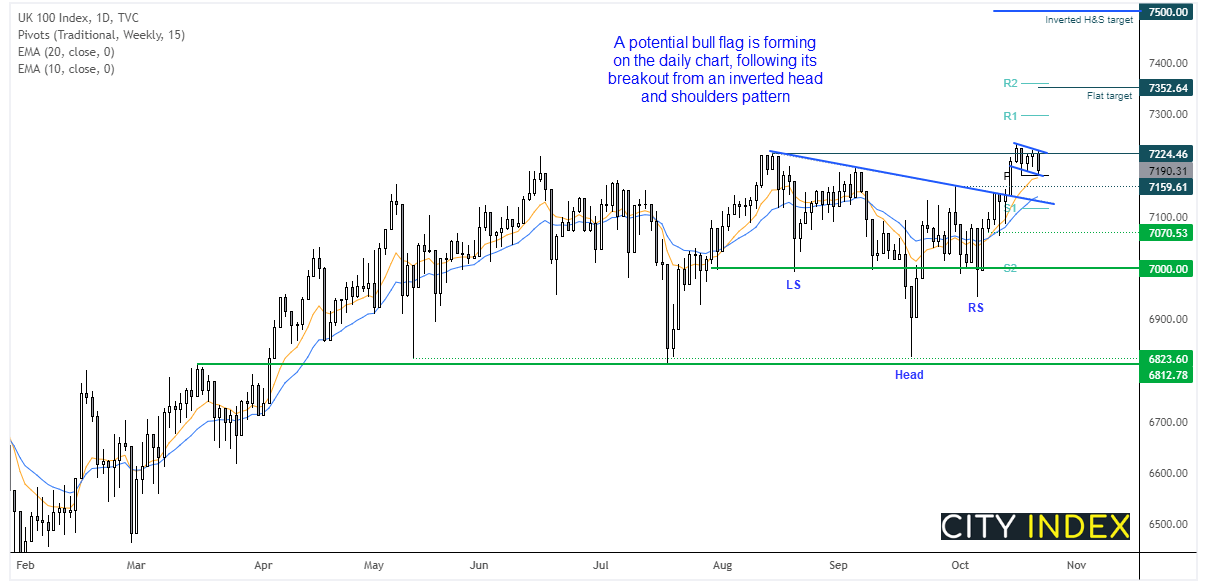

The FTSE 100 remains in a corrective phase following its inverted head and shoulders breakout on the 14th October. It shows the potential for a bull flag breakout on the daily chart, and yesterday’s low found support at the weekly pivot and 10-day eMA. We would therefore be interested in a break above the retracement line (and above yesterday’s high) to suggest momentum has realigned with the H&S breakout.
However, given the two most bearish days in the flag are bearish, we are also on guard for a downside break of yesterday’s low which would brings 7160 support into view.
FTSE 350: Market Internals

FTSE 350: 4119.22 (-0.45%) 21 October 2021
- 133 (37.89%) stocks advanced and 205 (58.40%) declined
- 5 stocks rose to a new 52-week high, 5 fell to new lows
- 56.98% of stocks closed above their 200-day average
- 98.29% of stocks closed above their 50-day average
- 18.23% of stocks closed above their 20-day average
Outperformers:
- + 11.1%-Renishaw PLC(RSW.L)
- + 4.74%-Syncona Ltd(SYNCS.L)
- + 4.22%-Darktrace PLC(DARK.L)
Underperformers:
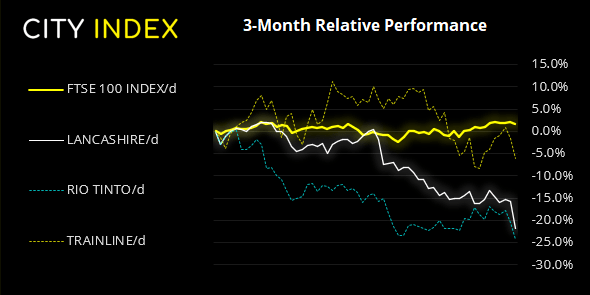
- -7.31%-Lancashire Holdings Ltd(LRE.L)
- -4.84%-Rio Tinto PLC(RIO.L)
- -4.56%-Trainline PLC(TRNT.L)
Forex:
Flash PMI’s are the highlight of today’s economic calendar. Traders like them as they provide a forward look at growth potential, making them one of the preferred leading indictors to trade around.
View today’s video: The Yen Fights Back
Asia has already kicked off and there are some positive signs. Australia’s composite PMI (manufacturing and services combined) expanded at 52.2, up from 46 in September as the services component expanded for the first month in 3. Japan’s manufacturing PMI rose to a 6-month. Separately, rising energy costs saw
- German manufacturing PMI: 56.5 forecast (58.4 prior)
- German Services PMI: 55 forecast (56.2 prior)
- Eurozone manufacturing PMI: 57 forecast (58.6 prior)
- Eurozone Services PMI: 55.5 forecast (58.4 prior)
- UK manufacturing PMI: 55.8 forecast (57.1 prior)
- UK Services PMI: 54.5 forecast (55.4 prior)
- US manufacturing PMI: 60.3 forecast (60.7 prior)
- US Services PMI: 55.1 forecast (54.9 prior)
Take note that retail sales for UK and Canada are also released at
GBP/USD is on track for a 3rd bullish week. 1.3773 is today’s key level for bulls to defend. USD/CAD looks favourable for further upside (should today’s data allow) and perhaps for a run towards yesterday’s high or even the 1.2410 resistance. We suspect the pair has seen a low at 1.2300. USD/JPY is back above 1.14 and is also a preferred pair for bullish setups, should US data come in stronger than expected.
Commodities:
Oil remains a market to watch, given the key reversal days on WTI and Brent. But for that we could do with a stronger US dollar, so hopefully it can find some buyers now the US dollar index has found support above 93.50.
Up Next (Times in BST)
How to trade with City Index
You can trade easily trade with City Index by using these four easy steps:
- Open an account, or log in if you’re already a customer
• Open an account in the UK
• Open an account in Australia
• Open an account in Singapore
- Search for the company you want to trade in our award-winning platform
- Choose your position and size, and your stop and limit levels
- Place the trade
How to trade with FOREX.com
Follow these easy steps to start trading with FOREX.com today:
- Open a Forex.com account, or log in if you’re already a customer.
- Search for the pair you want to trade in our award-winning platform.
- Choose your position and size, and your stop and limit levels.
- Place the trade.


Open an account in minutes
Experience award-winning platforms with fast and secure execution.
Economic calendar
Web Trader platform
Our sophisticated web-based platform is packed with features.
Related articles
Gold coils for potential breakout as US CPI looms
Gold's ascending triangle is putting $4,140 firmly in focus ahead of US CPI. With traditional macro relationships offering few clues, the price action may prove more useful for traders.

USD/CAD Outlook: Loonie left behind as US CPI looms
USD/CAD's sharp rebound has coincided with widening US–Canada interest rate differentials. With US CPI approaching and bullish momentum building, another breakout may be on the cards.

Japanese Yen Outlook: EUR/JPY and GBP/JPY Outbid USD/JPY
The Japanese yen starts the week mixed, with EUR/JPY and GBP/JPY showing bullish potential while USD/JPY remains stuck in a rut.
The information on this web site is not targeted at the general public of any particular country. It is not intended for distribution to residents in any country where such distribution or use would contravene any local law or regulatory requirement. The information and opinions in this report are for general information use only and are not intended as an offer or solicitation with respect to the purchase or sale of any currency or CFD contract. All opinions and information contained in this report are subject to change without notice. This report has been prepared without regard to the specific investment objectives, financial situation and needs of any particular recipient. Any references to historical price movements or levels is informational based on our analysis and we do not represent or warranty that any such movements or levels are likely to reoccur in the future. While the information contained herein was obtained from sources believed to be reliable, author does not guarantee its accuracy or completeness, nor does author assume any liability for any direct, indirect or consequential loss that may result from the reliance by any person upon any such information or opinions.
Futures, Options on Futures, Foreign Exchange and other leveraged products involves significant risk of loss and is not suitable for all investors. Losses can exceed your deposits. Increasing leverage increases risk. Spot Gold and Silver contracts are not subject to regulation under the U.S. Commodity Exchange Act. Contracts for Difference (CFDs) are not available for US residents. Before deciding to trade forex, commodity futures, or digital assets, you should carefully consider your financial objectives, level of experience and risk appetite. Any opinions, news, research, analyses, prices or other information contained herein is intended as general information about the subject matter covered and is provided with the understanding that we do not provide any investment, legal, or tax advice. You should consult with appropriate counsel or other advisors on all investment, legal, or tax matters. References to FOREX.com or GAIN Capital refer to StoneX Group Inc. and its subsidiaries. Please read Characteristics and Risks of Standardized Options.