


Key Events:
- A 25 bps Fed rate cut appears largely priced in, but the FOMC statement may deliver uncertain or even hawkish surprises.
- DXY continues to hold just below 99, while EURUSD remains steady above 1.1620.
- Nasdaq is hovering above 26,000, with overbought risks in sight ahead of the FOMC meeting and mega cap earning reports.
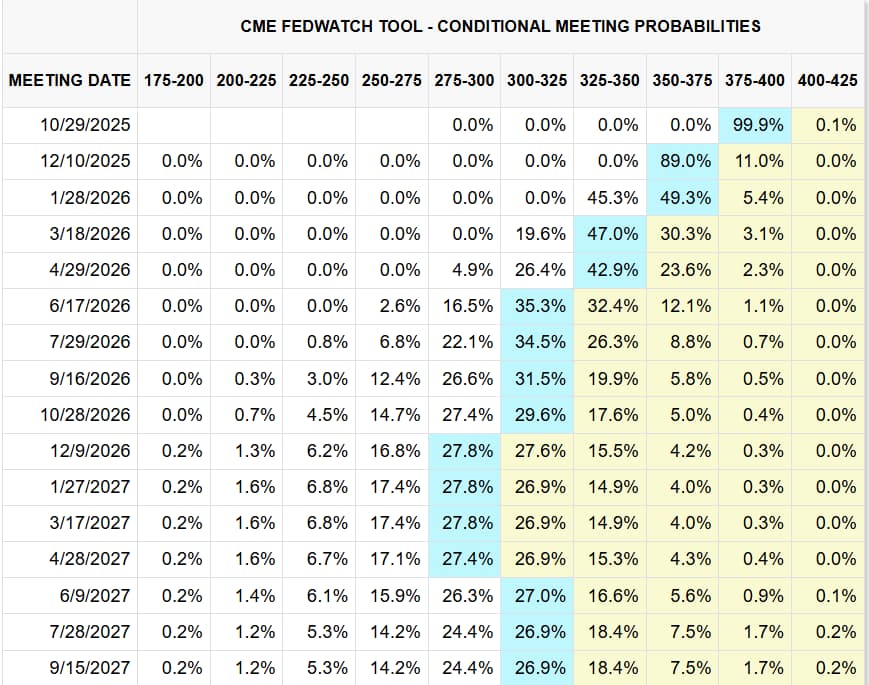 Source: CME Fed Watch Tool
While markets still anticipate two more rate cuts later this year, the DXY remains within its range near the 99 mark, supported above 96, which aligns with a 17-year uptrend on the chart.
Rate cuts may already be priced into the index; however, key insights from the FOMC meeting—particularly regarding labor market risks, the ongoing U.S. government shutdown, and the impact of tariffs—remain uncertain.
This keeps an element of risk against stretched U.S. index highs, which are currently driven by mega-cap earnings and renewed U.S.–China trade optimism.
Earnings Forecasts
- Microsoft (MSFT): Revenue $75.32B, EPS $3.66, Market Cap just reached $4 trillion.
- Google (Alphabet): Revenue $99.79B, EPS $2.29.
- Meta: Revenue $49.36B, EPS $6.68.
Scheduled for tomorrow:
- Apple: Revenue $101.69B, EPS $1.76.
- Amazon: Revenue $177.75B, EPS $1.56.
Technical Analysis: Quantifying Uncertainties
EURUSD Outlook: 4-Hour Time Frame – Log Scale
Source: Tradingview
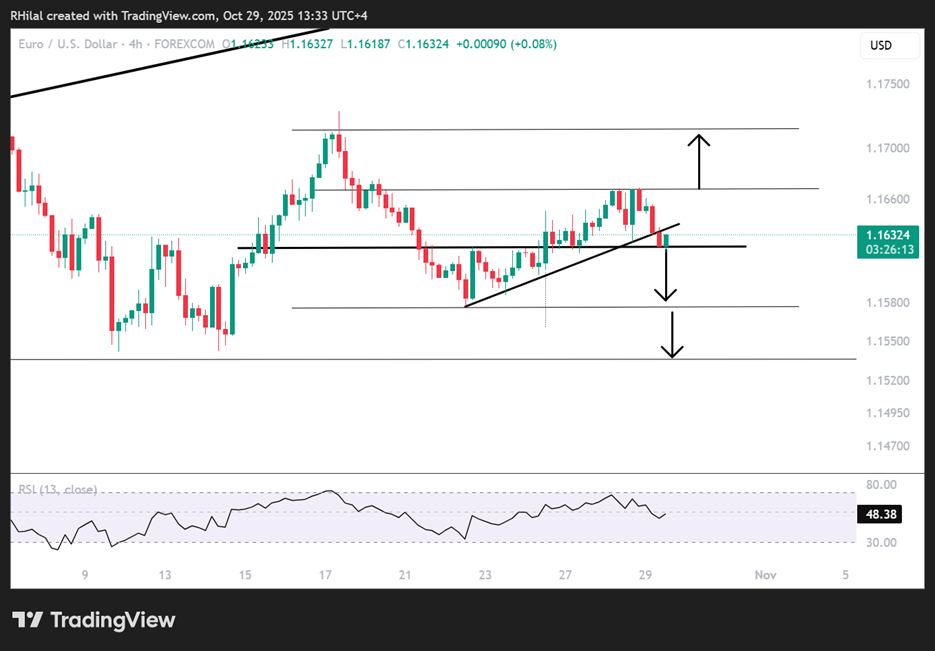
The EURUSD pair has pulled back twice from the 1.1670 resistance, potentially forming a double-top pattern ahead of the FOMC meeting, while still holding above 1.1620.
Bearish Scenario:
A clean break and hold below 1.1600 could extend losses toward 1.1570 and 1.1530, aligning with monthly lows before confirming another leg lower.
Bullish Scenario:
A sustained move above 1.1680 could extend gains toward 1.1730, with 1.1800 next in sight, potentially confirming further upside toward the 1.20 and 1.23 marks.
EURUSD Outlook: Weekly Time Frame – Log Scale
Source: Tradingview
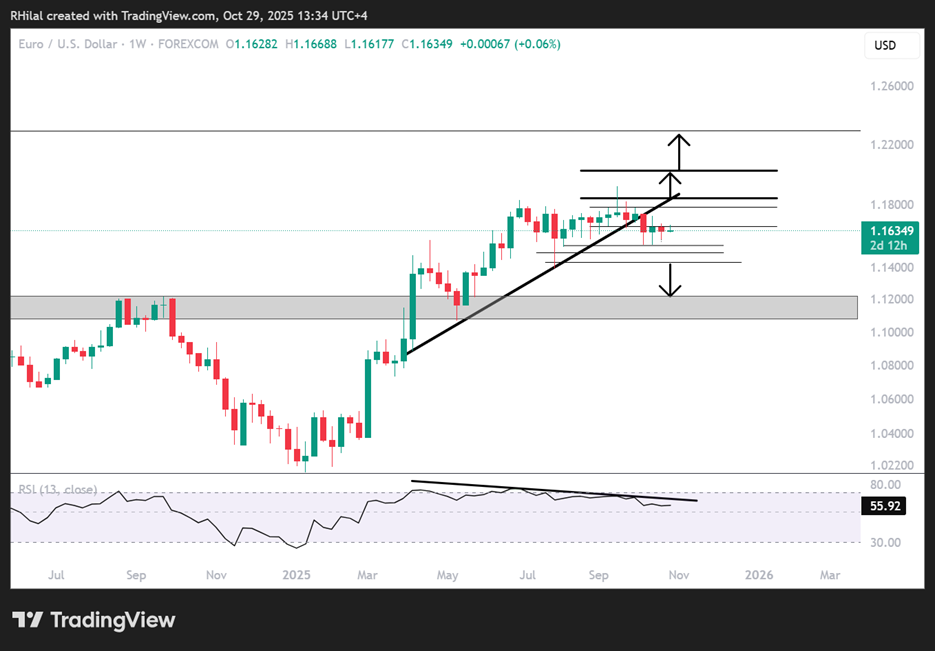
On the weekly chart, a prolonged bearish divergence can be observed between price action and the RSI (14) from April 2025 through October 2025, amplifying downside bias as the pair continues to trade below the trendline connecting consecutive higher lows from that period.
Longer-term levels:
A confirmed close below 1.1530 (monthly lows) could extend the decline toward 1.1490 and 1.1430, and in extreme cases down to 1.1200, aligning with a previous resistance-turned-support zone extending back to January 2023.
Nasdaq Outlook: Weekly Time Frame – Log Scale
Source: Tradingview
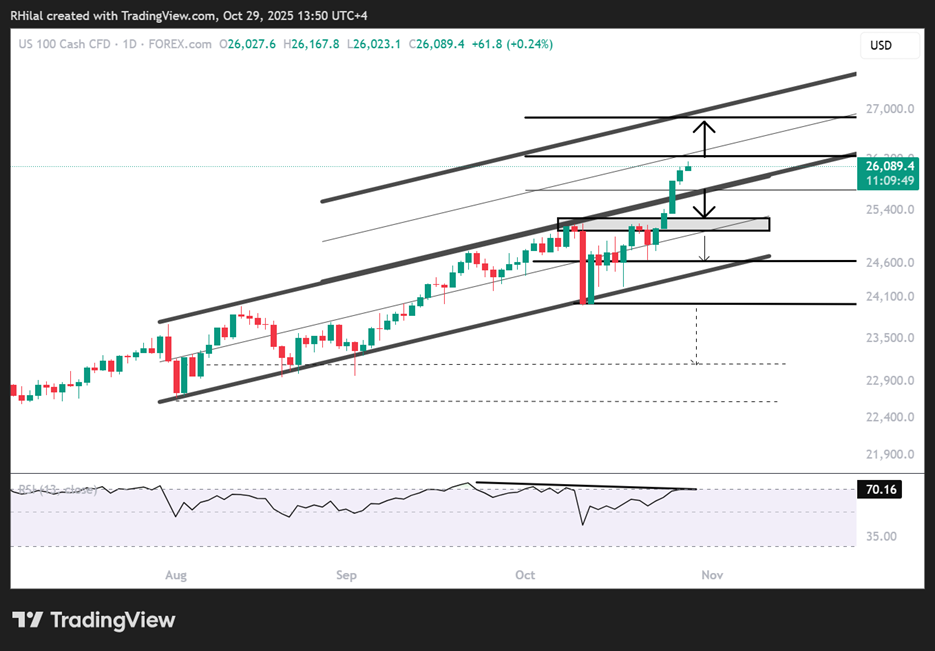
Having broken above the 26,000 mark, the Nasdaq has also moved beyond the upper boundary of a channel respected since July 2025, now trading within the duplicated (parallel) channel structure.
The mid-zone of this duplicated channel represents initial resistance near 26,300, and a confirmed breakout above this level could extend gains toward the upper boundary near 26,800.
On the downside, a move back below 25,900 could trigger a sharper pullback toward 25,400—the opening gap area from Monday—with additional support near 25,200.
The weekly RSI continues to diverge negatively from price action, signaling caution near current record highs.
Written by Razan Hilal, CMT
Follow on X: @Rh_waves






