




EUR/USD Tanks on Trump Win, Bounces from 1.0700
Today has been the largest one-day sell-off in EUR/USD since September of 2022 which, interestingly, happened just a couple days before the pair set a multi-year low. The big question now is whether EUR/USD and in-turn DXY are in position to break the multi-year range that’s built in each market.
Share this:

EUR/USD Talking Points:
- EUR/USD is working on its largest one-day sell-off since September 22, 2022. Interestingly, that was a few days before the multi-year low was set.
- While volatility enveloped global markets with the US Dollar, US rates and US equities all pushing higher, the reality is that it’s unlikely for all three asset classes to continue with strong gains for an extended period of time.
- In the earlier article looking at macro markets, I shared my expectation for the USD to retain the two-year range that’s been a driving force in USD price action. I expand on that below looking at the largest constituent of DXY in EUR/USD.
There aren’t many macro markets that haven’t seen strong volatility over the past 24 hours, and EUR/USD is no different. The pair is currently working on its largest single day sell-off since September of 2022 which, interestingly, showed just a few days before the pair had bottomed. There’s already been a bit of bounce in the pair from the 1.0700 handle and that’s leading to an extended wick on the daily bar.
EUR/USD Two-Hour Price Chart
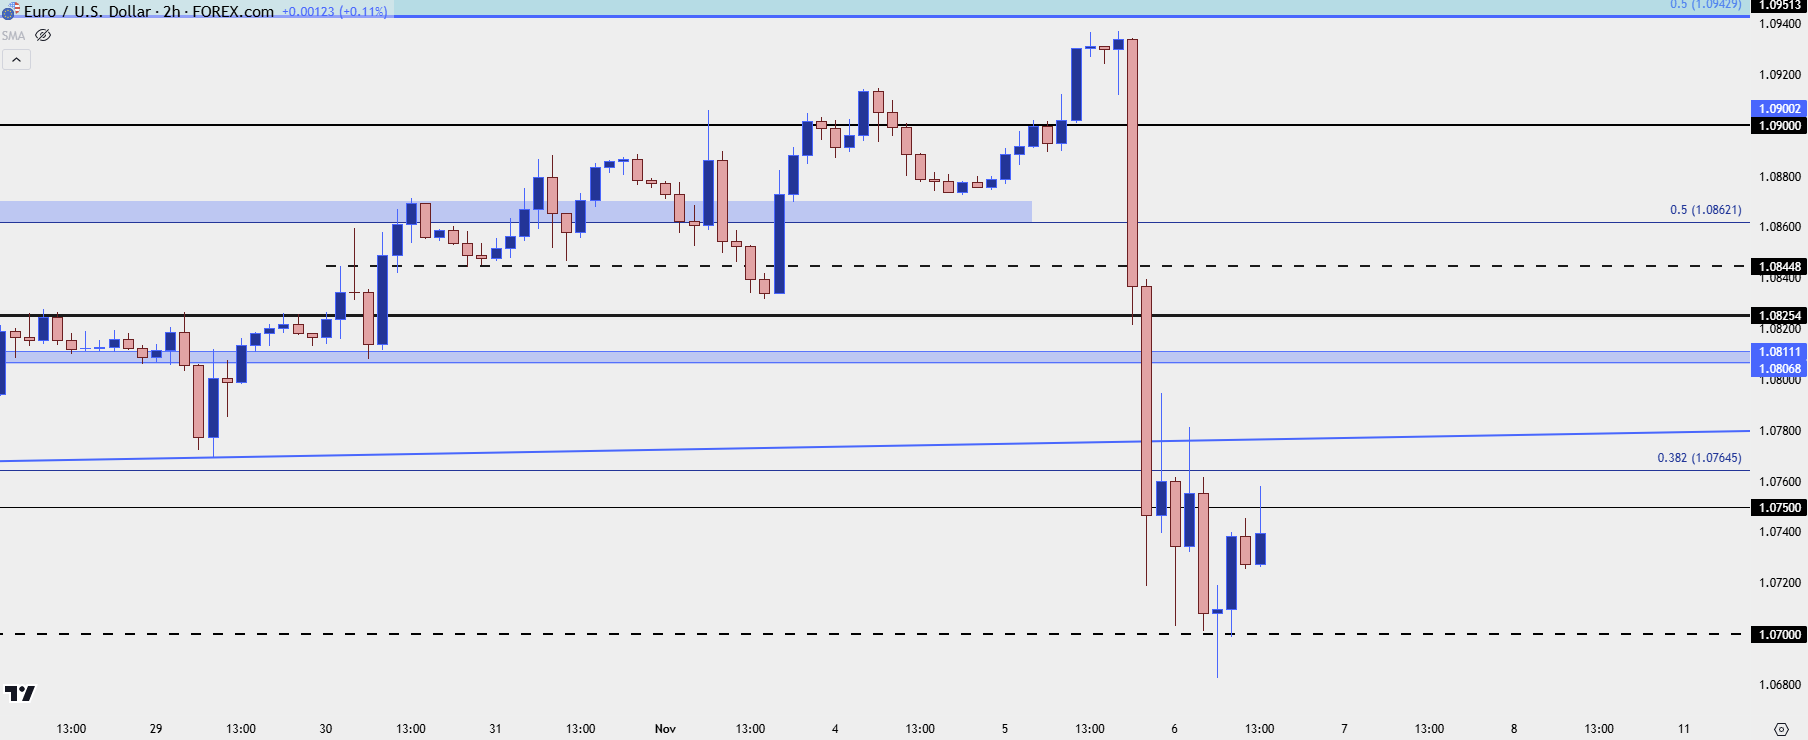 Chart prepared by James Stanley, EUR/USD on Tradingview
As I looked at in yesterday’s webinar ahead of the election, I consider EUR/USD to be one of the more attractive major pairs for scenarios of USD-strength. A large part of that is the fact that, even when the US Dollar was showing weakness in late-Q3 trade, the pair remained in a range formation.
Resistance continued to hold in EUR/USD around the 1.1200 handle, which was a lower-high below last year’s 1.1275 level. But, already, the pair has traversed a large portion of that range while making a fast run at longer-term supports.
Below the 1.0700 level that’s currently helping to bring a short-term bounce, it’s the 1.0611-1.0643 zone that held the lows earlier in the year; and then the 1.0500 level that held the lows last year. That’s what I’m considering as range support in EUR/USD, and that goes along with the range resistance looked at in the article and video earlier today.
EUR/USD Weekly Chart
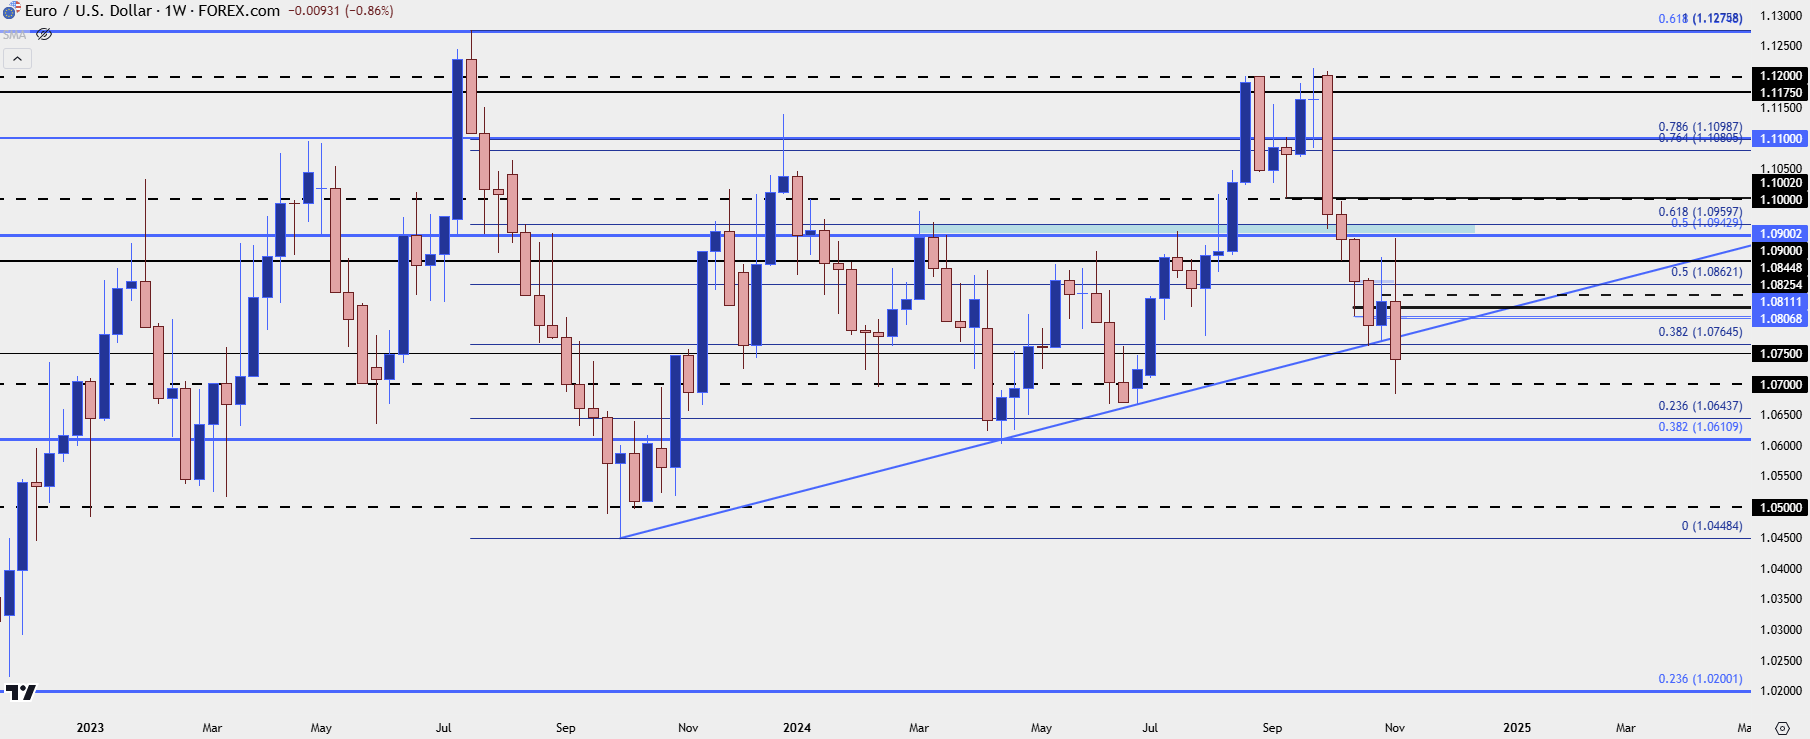 Chart prepared by James Stanley, EUR/USD on Tradingview
EUR/USD Strategy
The Fed is widely expected to cut tomorrow and the tone with which Powell talks about that in the press conference will be key. The Fed has been noticeably dovish especially when cutting rates by 50 basis points in September, even with many measures of inflation in the US indicating stall or entrenchment. If Powell does sound a bit more dovish, similar to how Janet Yellen sounded in the wake of Trump’s first victory in 2016 on the back of a Republican supermajority, there could be additional drive for USD-strength and EUR/USD weakness.
But – if Powell sings a similar dovish refrain, there could be motive for profit taking in the sell-off and that can set up an interesting scenario, where traders can then watch prior points of support to see if sellers come into defend lower-high resistance. For that, we’re already near a big spot at 1.0765 which is the level I looked at a couple weeks ago for a bounce. Above that, the 1.0807-1.0811 zone is of interest, followed by a shorter-term spot at 1.0825 and 1.0845. If the bounce does extend, I’d expect a big test at 1.0862-1.0872 which is where the 200-day moving average resides.
EUR/USD Daily Price Chart
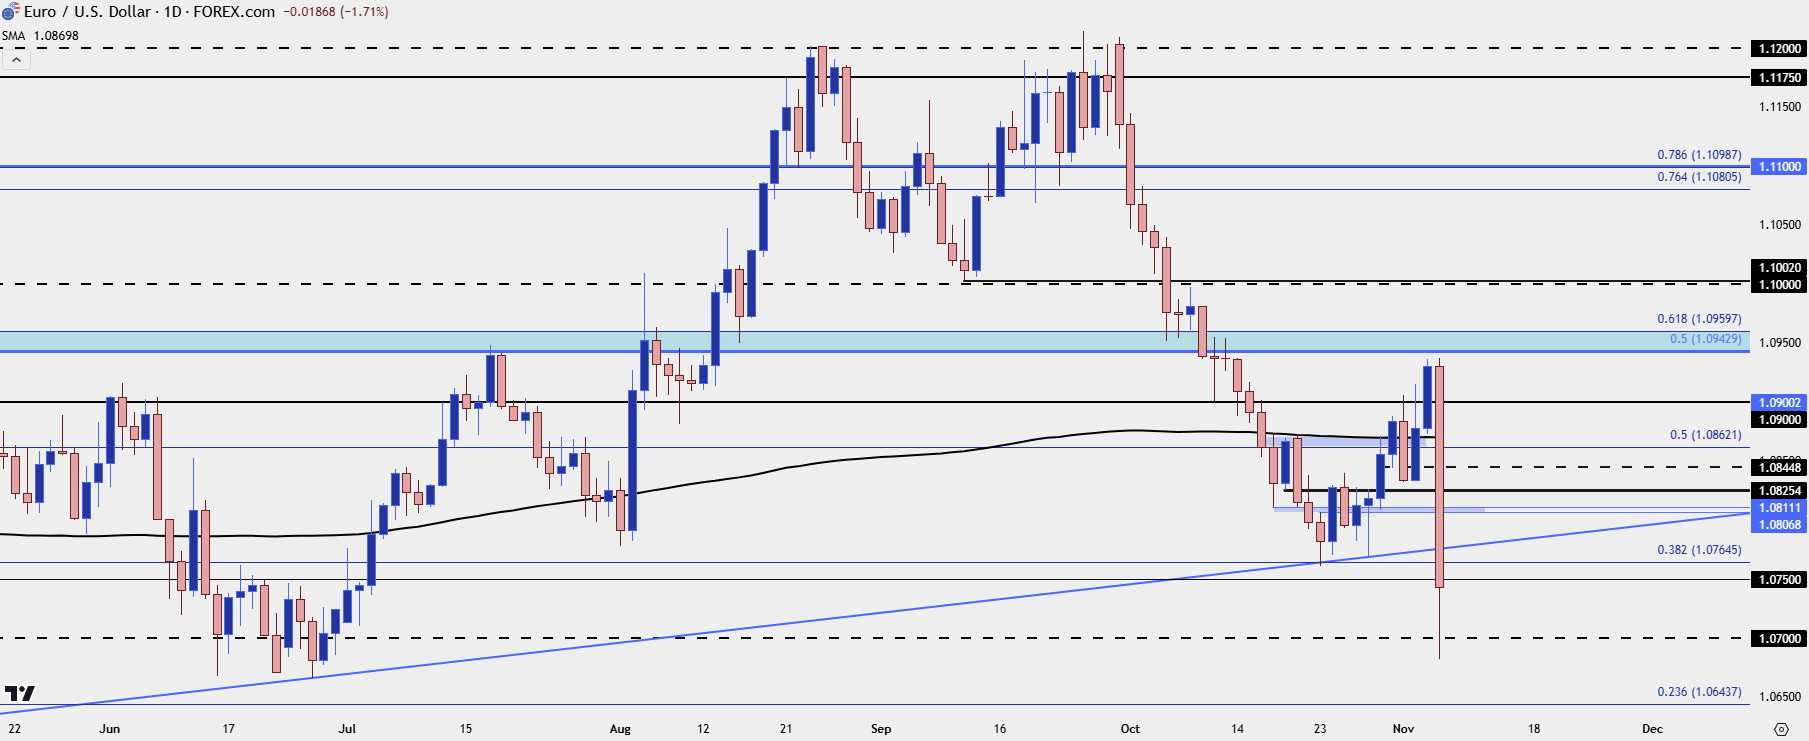 Chart prepared by James Stanley, EUR/USD on Tradingview
--- written by James Stanley, Senior Strategist
EUR/USD Talking Points:
- EUR/USD is working on its largest one-day sell-off since September 22, 2022. Interestingly, that was a few days before the multi-year low was set.
- While volatility enveloped global markets with the US Dollar, US rates and US equities all pushing higher, the reality is that it’s unlikely for all three asset classes to continue with strong gains for an extended period of time.
- In the earlier article looking at macro markets, I shared my expectation for the USD to retain the two-year range that’s been a driving force in USD price action. I expand on that below looking at the largest constituent of DXY in EUR/USD.
There aren’t many macro markets that haven’t seen strong volatility over the past 24 hours, and EUR/USD is no different. The pair is currently working on its largest single day sell-off since September of 2022 which, interestingly, showed just a few days before the pair had bottomed. There’s already been a bit of bounce in the pair from the 1.0700 handle and that’s leading to an extended wick on the daily bar.
EUR/USD Two-Hour Price Chart
As I looked at in yesterday’s webinar ahead of the election, I consider EUR/USD to be one of the more attractive major pairs for scenarios of USD-strength. A large part of that is the fact that, even when the US Dollar was showing weakness in late-Q3 trade, the pair remained in a range formation.
Resistance continued to hold in EUR/USD around the 1.1200 handle, which was a lower-high below last year’s 1.1275 level. But, already, the pair has traversed a large portion of that range while making a fast run at longer-term supports.
Below the 1.0700 level that’s currently helping to bring a short-term bounce, it’s the 1.0611-1.0643 zone that held the lows earlier in the year; and then the 1.0500 level that held the lows last year. That’s what I’m considering as range support in EUR/USD, and that goes along with the range resistance looked at in the article and video earlier today.
EUR/USD Weekly Chart
EUR/USD Strategy
The Fed is widely expected to cut tomorrow and the tone with which Powell talks about that in the press conference will be key. The Fed has been noticeably dovish especially when cutting rates by 50 basis points in September, even with many measures of inflation in the US indicating stall or entrenchment. If Powell does sound a bit more dovish, similar to how Janet Yellen sounded in the wake of Trump’s first victory in 2016 on the back of a Republican supermajority, there could be additional drive for USD-strength and EUR/USD weakness.
But – if Powell sings a similar dovish refrain, there could be motive for profit taking in the sell-off and that can set up an interesting scenario, where traders can then watch prior points of support to see if sellers come into defend lower-high resistance. For that, we’re already near a big spot at 1.0765 which is the level I looked at a couple weeks ago for a bounce. Above that, the 1.0807-1.0811 zone is of interest, followed by a shorter-term spot at 1.0825 and 1.0845. If the bounce does extend, I’d expect a big test at 1.0862-1.0872 which is where the 200-day moving average resides.
EUR/USD Daily Price Chart
--- written by James Stanley, Senior Strategist
Related tags:
Latest market news




Open an account in minutes
Experience award-winning platforms with fast and secure execution.
Economic calendar
Web Trader platform
Our sophisticated web-based platform is packed with features.
Related articles
S&P 500, Nasdaq 100 Claw Back But NVDA Cloud Looms Overhead
Last week was green for both the Nasdaq and S&P 500 but given the sell-off that led into that bounce there’s still a very real question as to whether bears still have a statement to make. And the NVDA situation presents a very real threat.
US Dollar Price Action Setups: EUR/USD, USD/JPY
The US Dollar broke out to a fresh yearly high after the CPI report, and that Dollar strength was on full view in pretty much all major pairings with a particular push in EUR/USD.

US dollar forecast: USD/JPY and USD/CHF in focus | Forex Friday
Sticky US inflation and a hawkish Fed have kept the dollar firm across the majors, with USD/JPY pressing on the 160 handle. Here are the levels that matter on USD/JPY and USD/CHF as next week's retail sales, Nvidia results and FOMC minutes approach.

The information on this web site is not targeted at the general public of any particular country. It is not intended for distribution to residents in any country where such distribution or use would contravene any local law or regulatory requirement. The information and opinions in this report are for general information use only and are not intended as an offer or solicitation with respect to the purchase or sale of any currency or CFD contract. All opinions and information contained in this report are subject to change without notice. This report has been prepared without regard to the specific investment objectives, financial situation and needs of any particular recipient. Any references to historical price movements or levels is informational based on our analysis and we do not represent or warranty that any such movements or levels are likely to reoccur in the future. While the information contained herein was obtained from sources believed to be reliable, author does not guarantee its accuracy or completeness, nor does author assume any liability for any direct, indirect or consequential loss that may result from the reliance by any person upon any such information or opinions.
Futures, Options on Futures, Foreign Exchange and other leveraged products involves significant risk of loss and is not suitable for all investors. Losses can exceed your deposits. Increasing leverage increases risk. Spot Gold and Silver contracts are not subject to regulation under the U.S. Commodity Exchange Act. Contracts for Difference (CFDs) are not available for US residents. Before deciding to trade forex, commodity futures, or digital assets, you should carefully consider your financial objectives, level of experience and risk appetite. Any opinions, news, research, analyses, prices or other information contained herein is intended as general information about the subject matter covered and is provided with the understanding that we do not provide any investment, legal, or tax advice. You should consult with appropriate counsel or other advisors on all investment, legal, or tax matters. References to FOREX.com or GAIN Capital refer to StoneX Group Inc. and its subsidiaries. Please read Characteristics and Risks of Standardized Options.