GBP/USD Talking Points:
- Cable was one of the stronger major pairs as the USD sell-off was running through July and much of August, allowing for a fresh two-year-high in the pair.
- Last week saw a bounce appear after buyers showed up to defend the 1.3000 level. I think the big driver for next week will come from the USD side of the pair and as I shared in the weekly USD article, I think GBP/USD remains one of the more attractive venues for scenarios of further US Dollar weakness, along with USD/JPY.

Of the major FX pairs that I track, GBP/USD seemed to have one of the brighter backdrops earlier in the summer. The first test above the 1.3000 handle happened around the same time that RSI on the daily chart moved into overbought territory. The last time that either of those instances had taken place was a year prior, in July of 2023 when GBP/USD burst-above 1.3000 while RSI moved into overbought. That led into a prolonged sell-off that ran into October of that year.
But, for the more recent instance buyers stepped in at an important spot – at the trendline connecting 2022 and 2024 swing lows, the projection of which held bears at bay before leading to another sharp topside move. And that second test of 1.3000 in 2024 went much more smoothly for bulls than the first, with a strong topside breakout to fresh two-year-highs showing shortly after.
GBP/USD Daily Price Chart
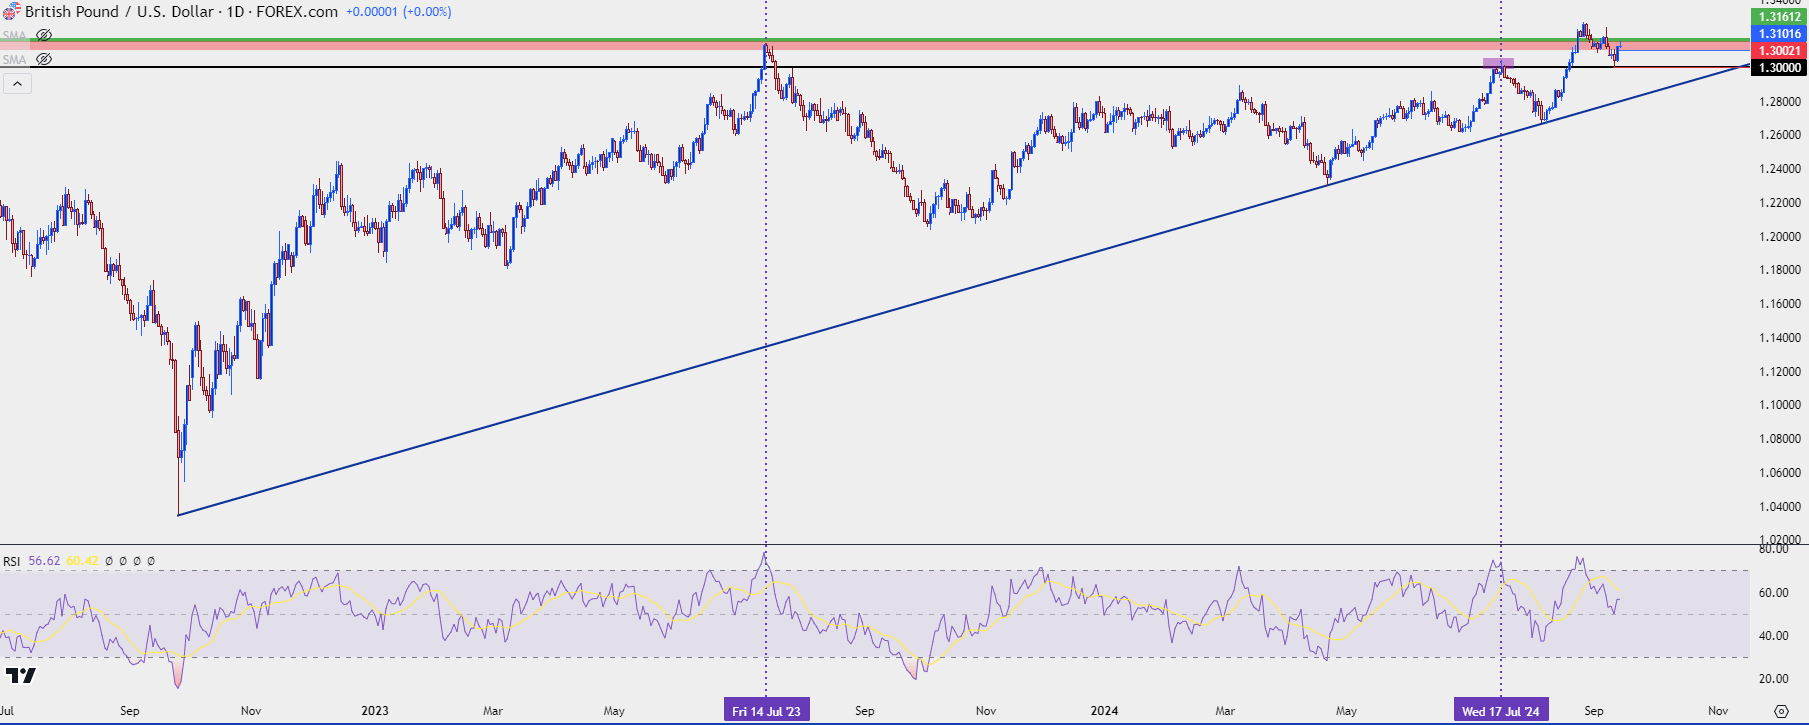 Chart prepared by James Stanley, GBP/USD on Tradingview
GBP/USD 1.3000 History
This isn’t the first time that big figure has been a big deal for Cable. Back in 2016 on the heels of the Brexit referendum GBP/USD initially probed-below a couple week after the vote, but sellers couldn’t leave it behind, at first. The next push was able to drive below that though, only for sellers to stall out at 1.2000 in early-2017. In the seven years that followed, the 1.3000 level has continually come back into play as both support and resistance without either side being able to leave it behind. There have been a number of inflections along the way, as you can see from the weekly chart below, and it remains a big deal for GBP/USD as we move into a really big week for the US Dollar next week.
GBP/USD Weekly Price Chart
 Chart prepared by James Stanley, GBP/USD on Tradingview
GBP/USD Shorter-Term
At this point I’m of the expectation that the USD is the pertinent item to follow for GBP/USD flows. When the USD sell-off was hitting through much of the summer, GBP/USD was one of the more attractive major FX pairs as I mentioned at the start of this article. Given the intensity of that sell-off and how oversold the USD had become, there could be further scope for retracement in the greenback. The X-factor there is next week’s FOMC rate decision and the ongoing saga around the USD/JPY carry trade. If there is further unwind there – which could be pushed by a dovish-leaning FOMC set of projections – then there could be case for more USD-weakness and that could benefit GBP/USD considerably.
If the Fed is more wait-and-see, however, that could push USD/JPY back from the ledge of support and contribute to a strong USD pullback, which could fast turn into another 1.3000 test in Cable.
Next week is big.
GBP/USD Daily Price Chart
 Chart prepared by James Stanley, GBP/USD on Tradingview
--- written by James Stanley, Senior Strategist