It’s been a turnaround couple of weeks for gold following the strong sell-off that took over in March. While worries about gold topping drove headlines it was a doji formation on the weekly chart two weeks ago that highlighted that change might be afoot. That change continued last week as bulls ran prices from a low of around $4400 to a high of around $4800, and as we go into the first full week of Q2, bulls have an open door to make a move and push a re-test of the $5k handle.
The item of importance from last week was a higher-low, with support around $4400 holding above the prior week swing low of $4100. For bears, there could still be a case to work with given how resistance has so far held below prior support in the $4850 area but given the broader trend and the longer-term backdrop, I think the bullish bias can remain as a more attractive side for now.
Gold Weekly Price Chart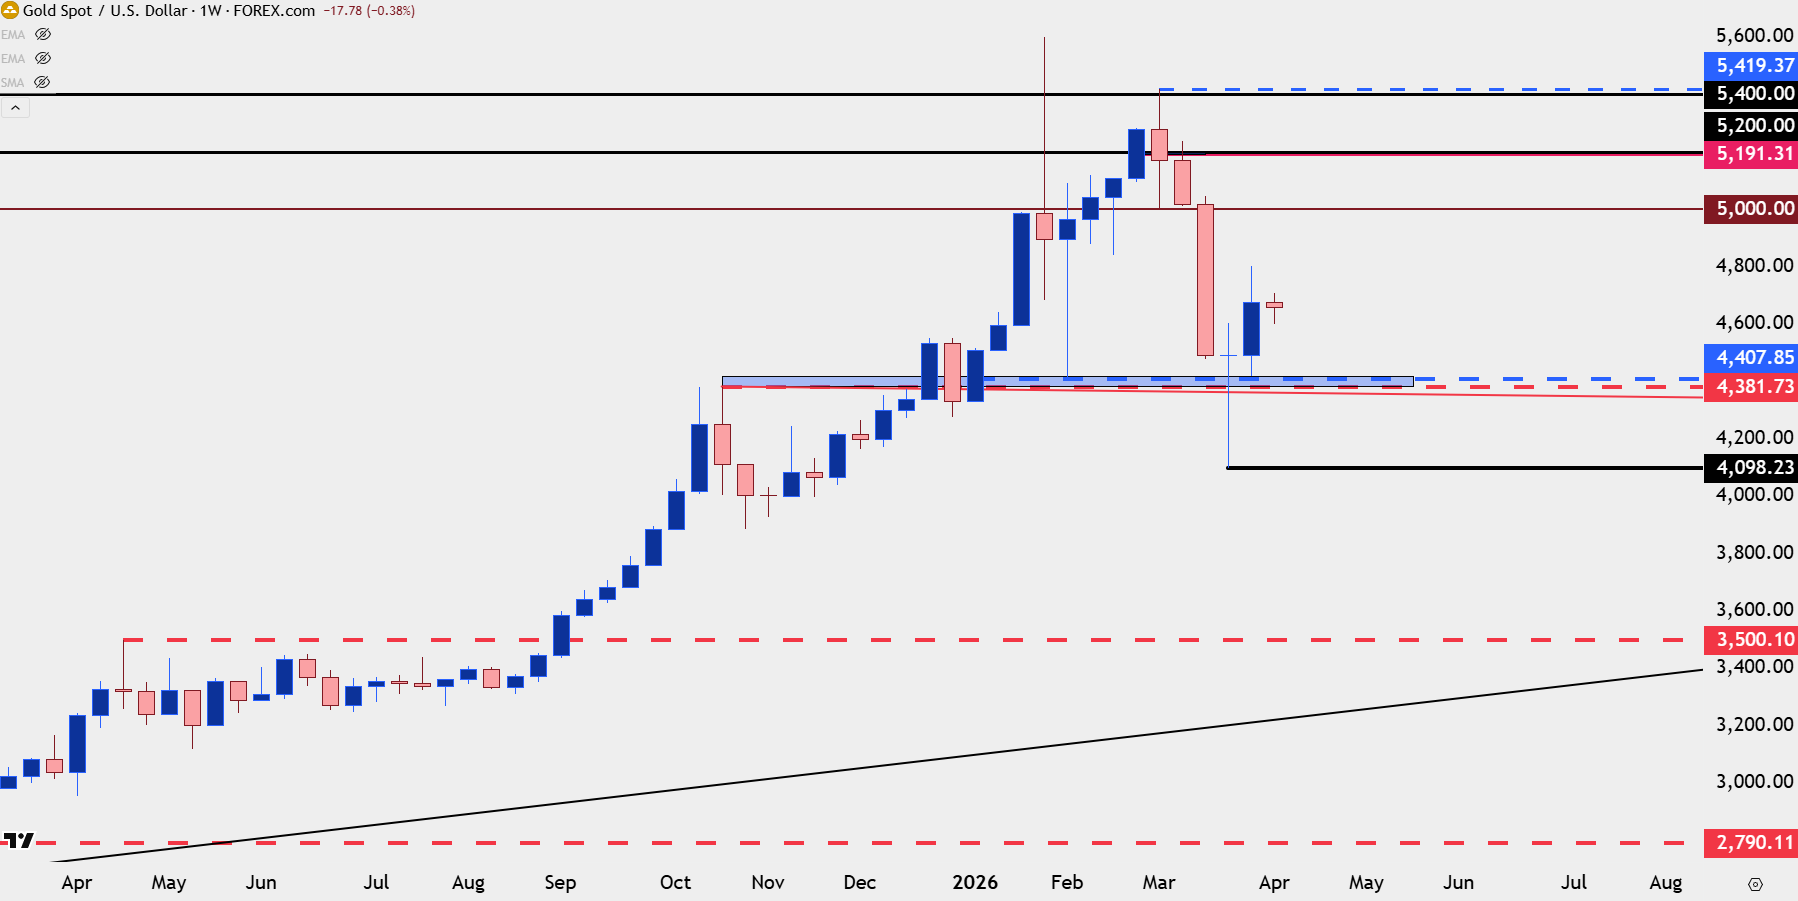
Chart prepared by James Stanley; data derived from Tradingview
Gold Strategy
The daily chart is where some strategy ideas begin to show as there’s been several inflections at rounded psychological whole levels over the past couple of months: Even the top set back in January was right around the $5600 level, with the initial pullback from that stopping at $4400 and the following bounce going up $1000 for a test of $5400.
On the way down in March, there were stalls or bounces at both $4500 and $4100 and resistance at $4600 and then $4800, leading us to our current setup where there’s been a hold of support at $4600, helping to show both support at prior resistance and bullish short-term structure as a higher-low from a recent higher-high.
Gold Daily Price Chart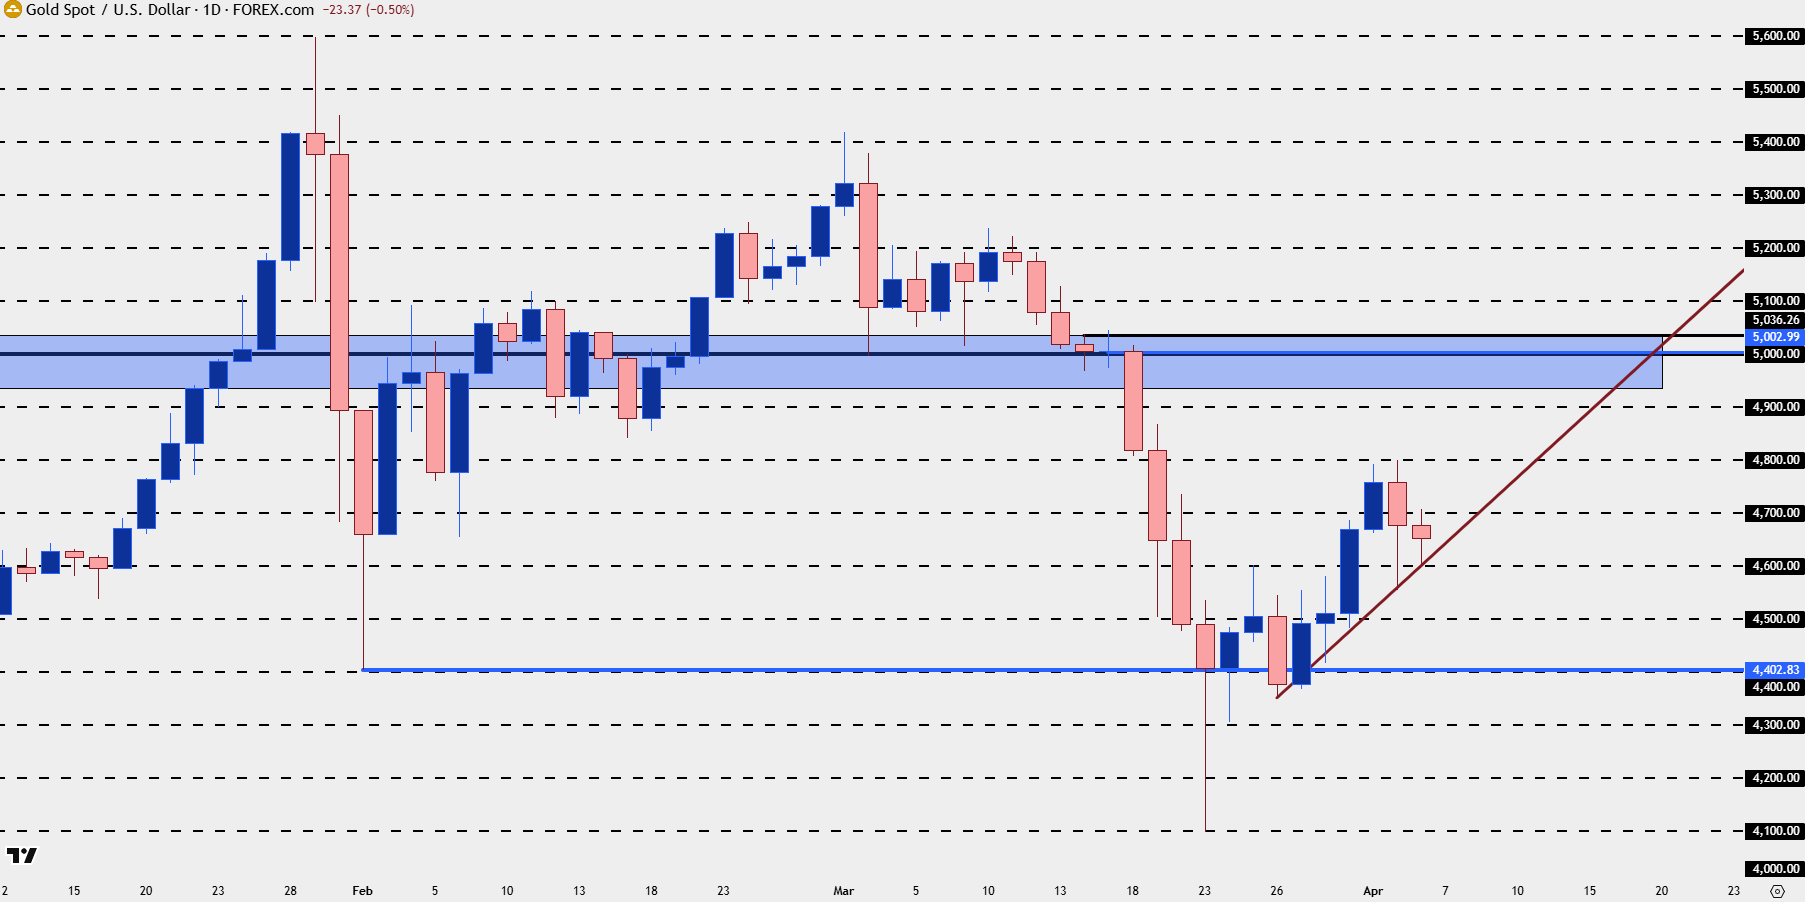
Chart prepared by James Stanley; data derived from Tradingview
Gold Four-Hour
Shorter-term there’s even more reference at round levels following last week’s hold of resistance at $4800 and, so far this week, the hold at $4700. There was also a support hold early last week at $4500 before price boosted up for a $4600 re-test, followed by the breakout.
At this point a break of $4700 opens the door for a re-test of $4800 and while there’s been less activity around $4900 so far, that would serve as a next resistance level up before re-test of the $5k level, which remains the big spot on longer-term charts.
Gold Four-Hour Chart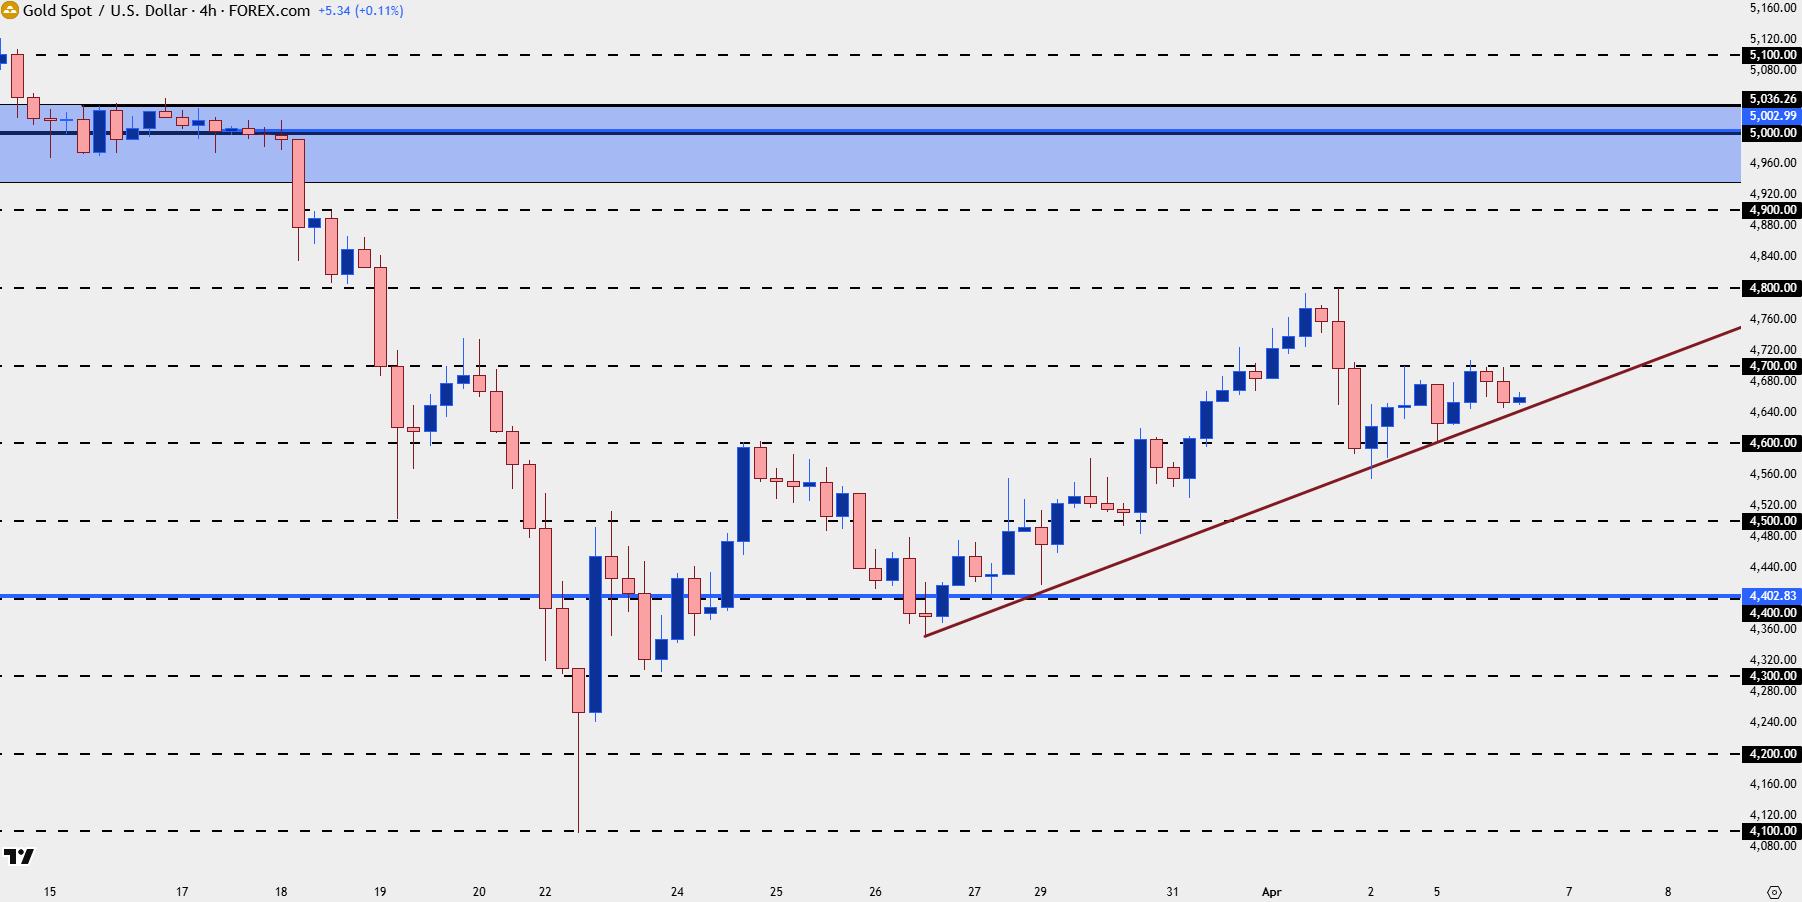
Chart prepared by James Stanley; data derived from Tradingview
--- written by James Stanley, Senior Market Analyst, Global Macro