Gold Talking Points:
- Gold prices love lower real yields. While higher rates present opportunity cost lower rates or even stagnant rates with higher levels of inflation signify currency debasement and the safer harbors of gold make sense in that backdrop.
- This is something that can have correlation with Fed policy but perhaps more important is long-term US Treasury rates, where market participants have a viable alternative for storing capital.

When I looked at gold in the Tuesday webinar I shared what bulls were going to need to do to take back control of the market. There were two hurdles that needed to be jumped, with each at psychological levels sitting overhead. The first, at $4100, was the price that held the highs last week, even with a below-target CPI and PPI print. The second, was the swing high from early July that was the last lower-high before prices pushed down into a stall.
This is important from a price action perspective – because the failure from sellers to push down to a fresh low, holding above the June 30 low at 3942 illustrated the possibility of bearish exhaustion. Given that this was around the $4k level, that story makes even more sense, considering that tests below $4k have been continually met with buyers – and if bulls were starting to show more optimism, more anticipation, and disallowing for price to even re-test those prior lows, we may be nearing a spot where they’re more willing to take greater control.
Gold Daily Chart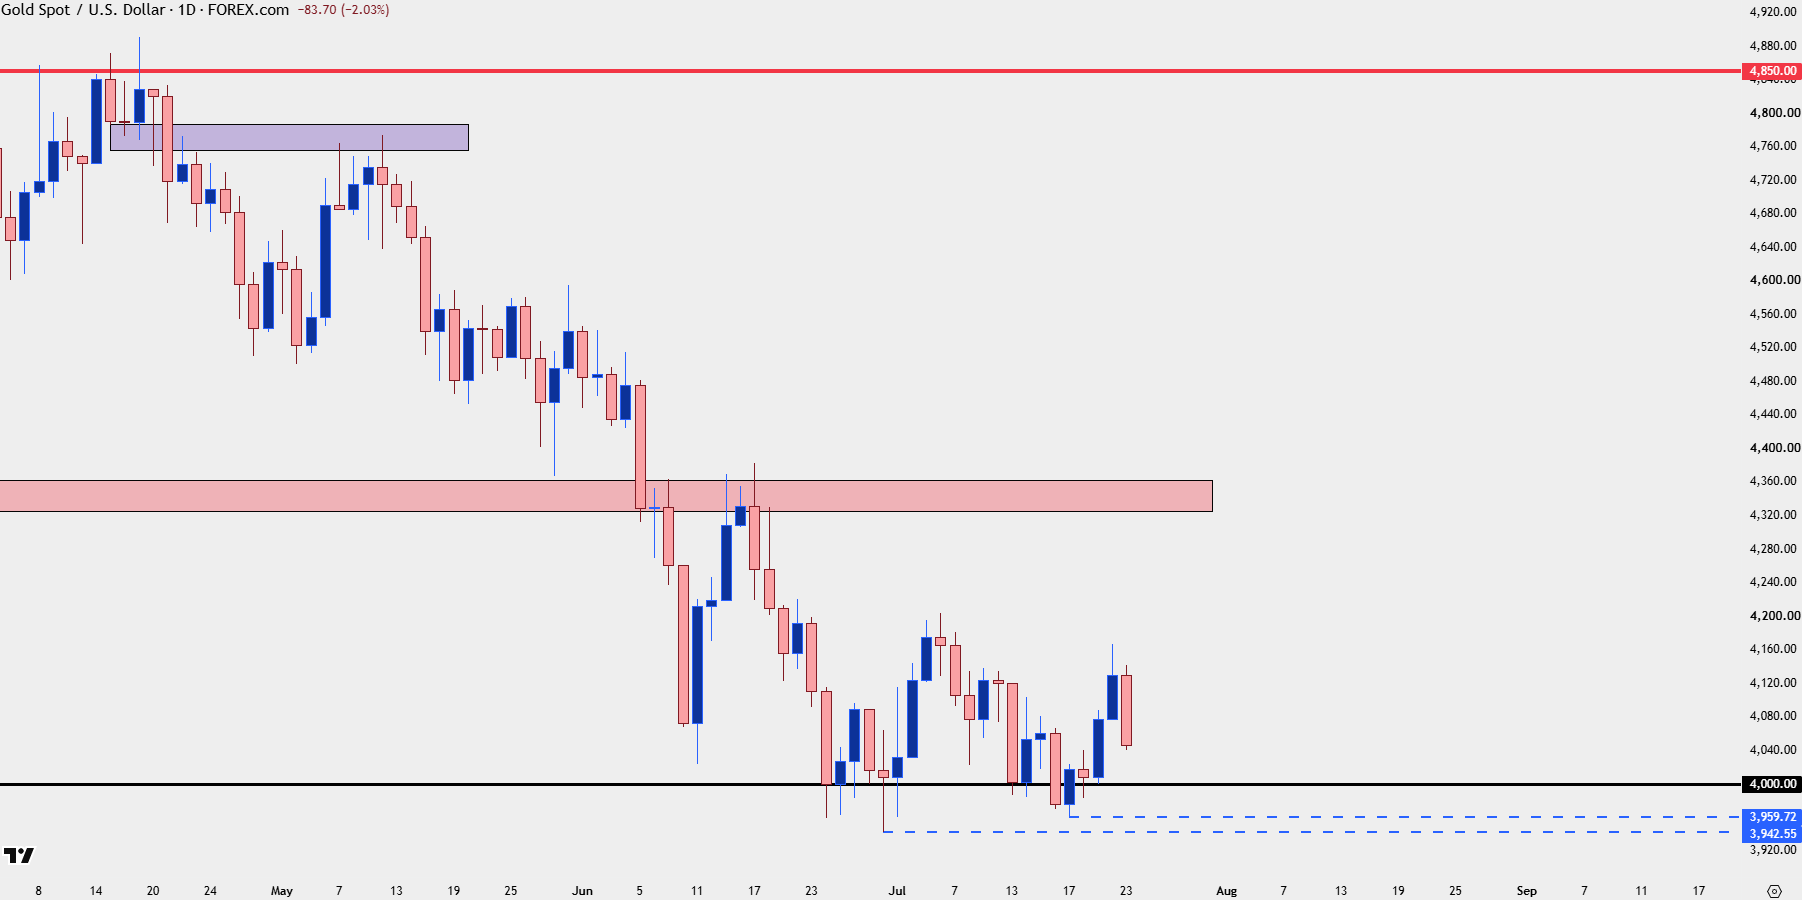
Chart prepared by James Stanley; data derived from Tradingview
Earlier this week and even into yesterday, that theme looked good, as bulls had pushed up to a fresh short-term higher-high. But since finding resistance yesterday that theme has been snapping back aggressively, with gold prices down by more than $100/oz as prices push into support at the $4044 level.
Gold Four-Hour Price Chart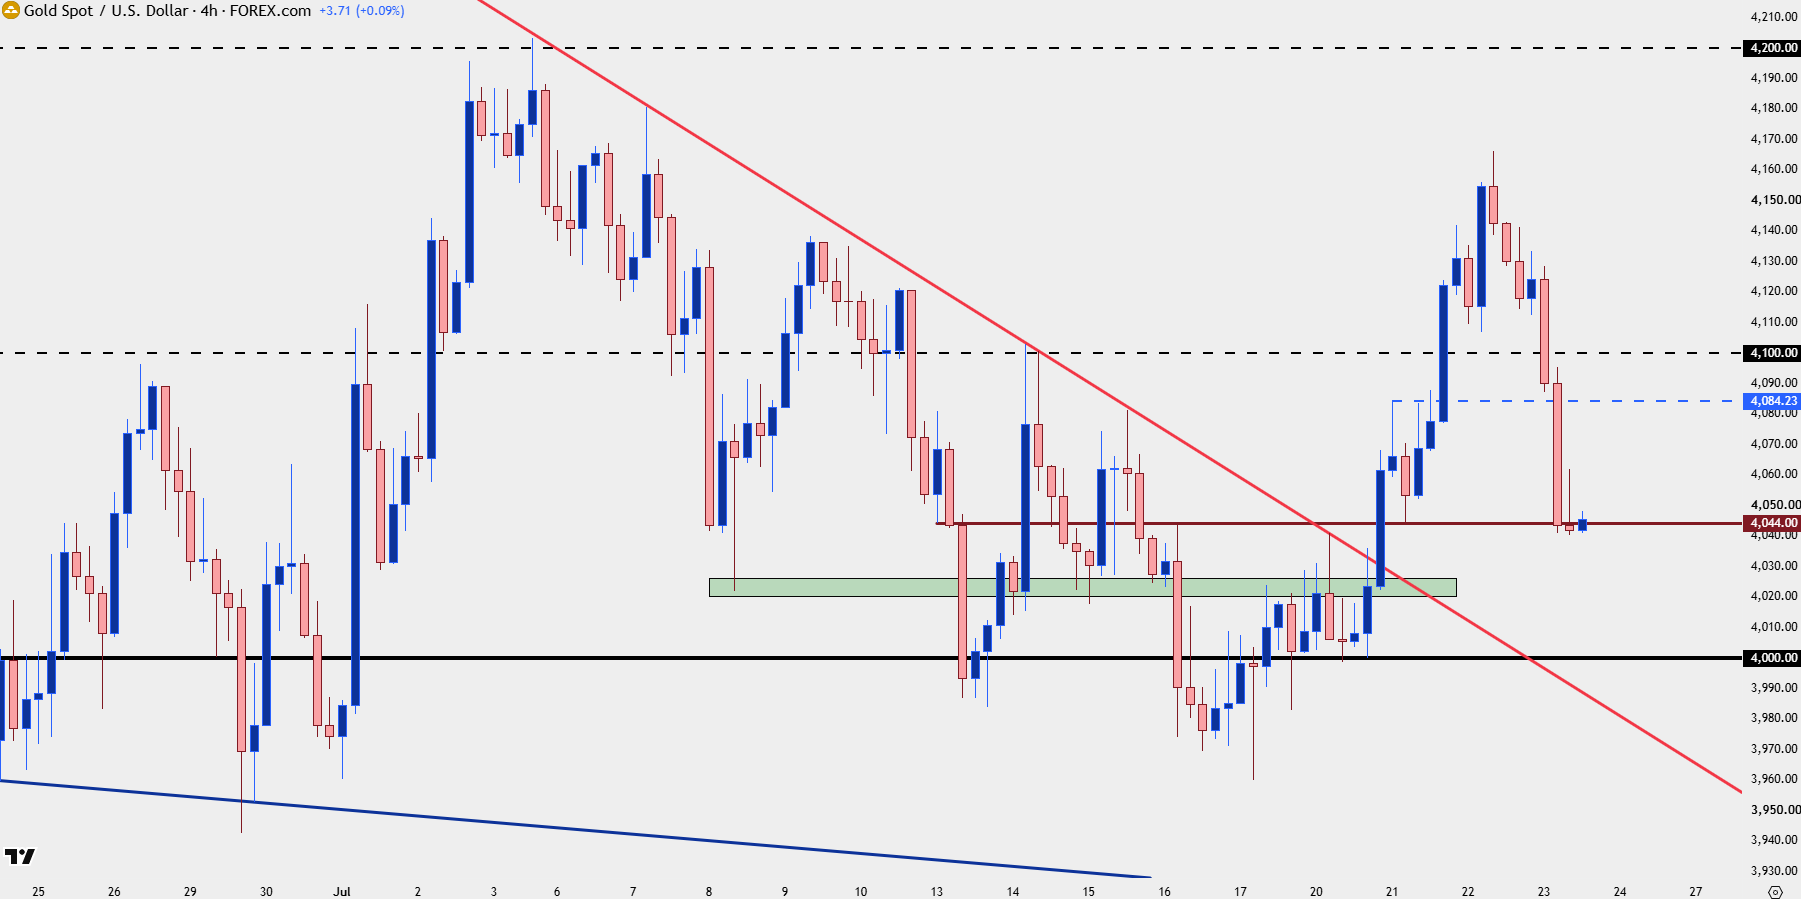
Chart prepared by James Stanley; data derived from Tradingview
This accompanies a rally in the US Dollar as the USD has broken out of a bull flag formation, and this happens as longer-term Treasury yields threaten a breakout to fresh highs, with the 30-year bond on the verge of jumping to levels last seen in 2007 before the Financial Collapse.
US Treasury 30-Year Bond Monthly Chart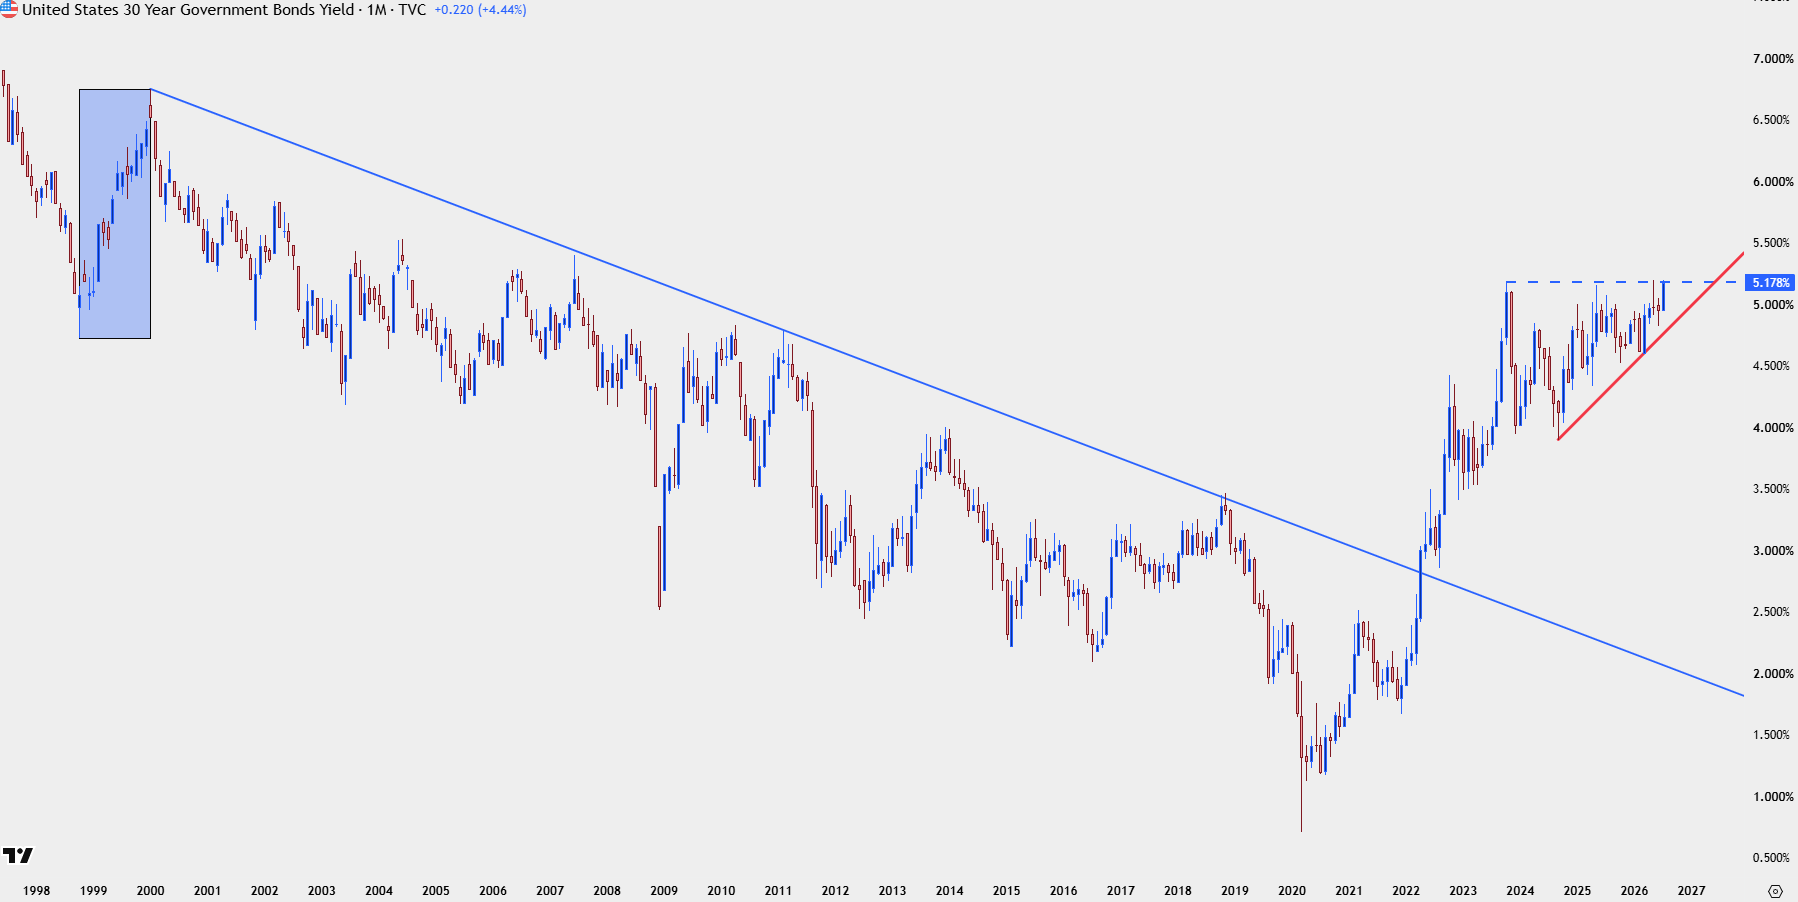
Chart prepared by James Stanley; data derived from Tradingview
Gold Strategy Near-Term
As we go into the weekly close the big question is whether bullish defense will show above the $4k level, and for that, we have two spots of interest. One is already in-play at $4044, the other is a swing of prior support-turned-resistance at $4021, and below that, even $4k can be argued as a point of support for bullish near-term setups.
But if buyers fail to hold the move – particularly if we get a weekly close below that vaulted $4k level, matters can begin to shift as the earlier week flare will take on the look of a failed bullish breakout.
Gold Two-Hour Price Chart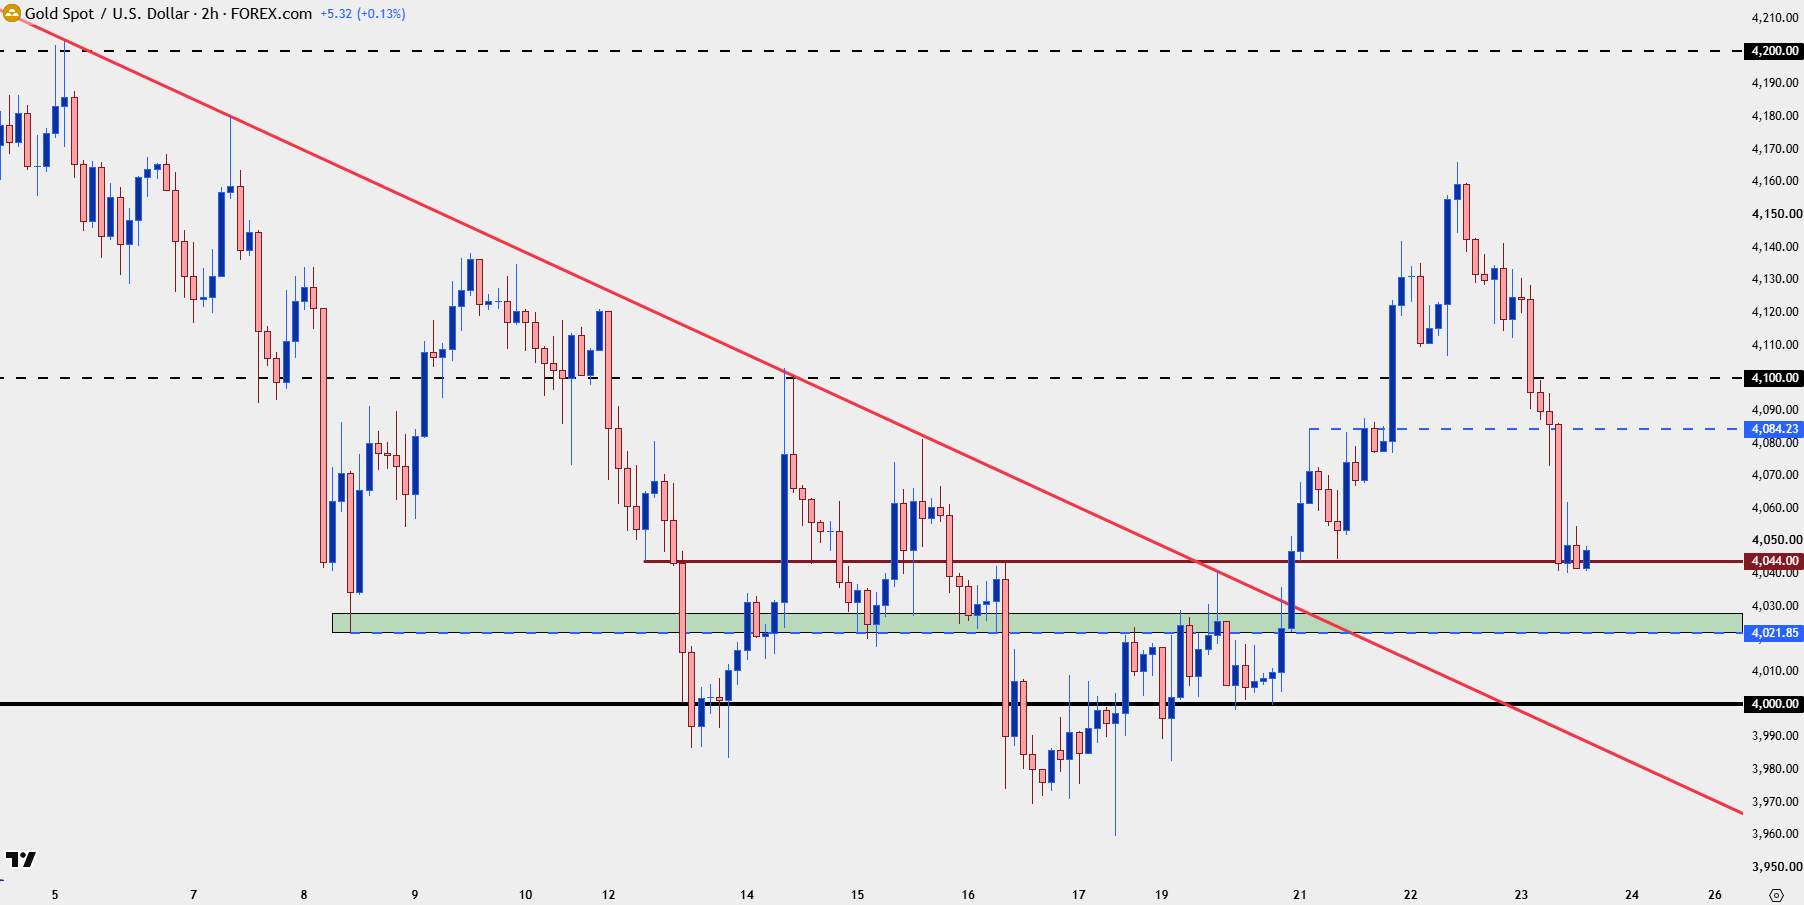
Chart prepared by James Stanley; data derived from Tradingview
--- written by James Stanley, Senior Market Analyst, Global Macro