



The fear from March seems to be comfortably in the rear-view mirror as US equities push towards fresh all-time highs. Despite the worry in many of the headlines indicating that the scenario around Iran isn’t quite at a head, markets seem to hold less worry around the matter as there’s been a massive recovery in risk and this is something that’s shown through gold, Bitcoin and stocks.
On a shorter-term basis, gold is holding on to breakout potential as resistance from prior support of 4850 has now held a couple of different tests. And while resistance holding may be a difficult factor to consider for bullish scenarios, it’s the higher-lows that have built on the other side that makes for a more enticing backdrop for buyers, as that diminishing marginal impact of resistance leads into an ascending triangle formation, which is no stranger to gold.
Gold Daily Chart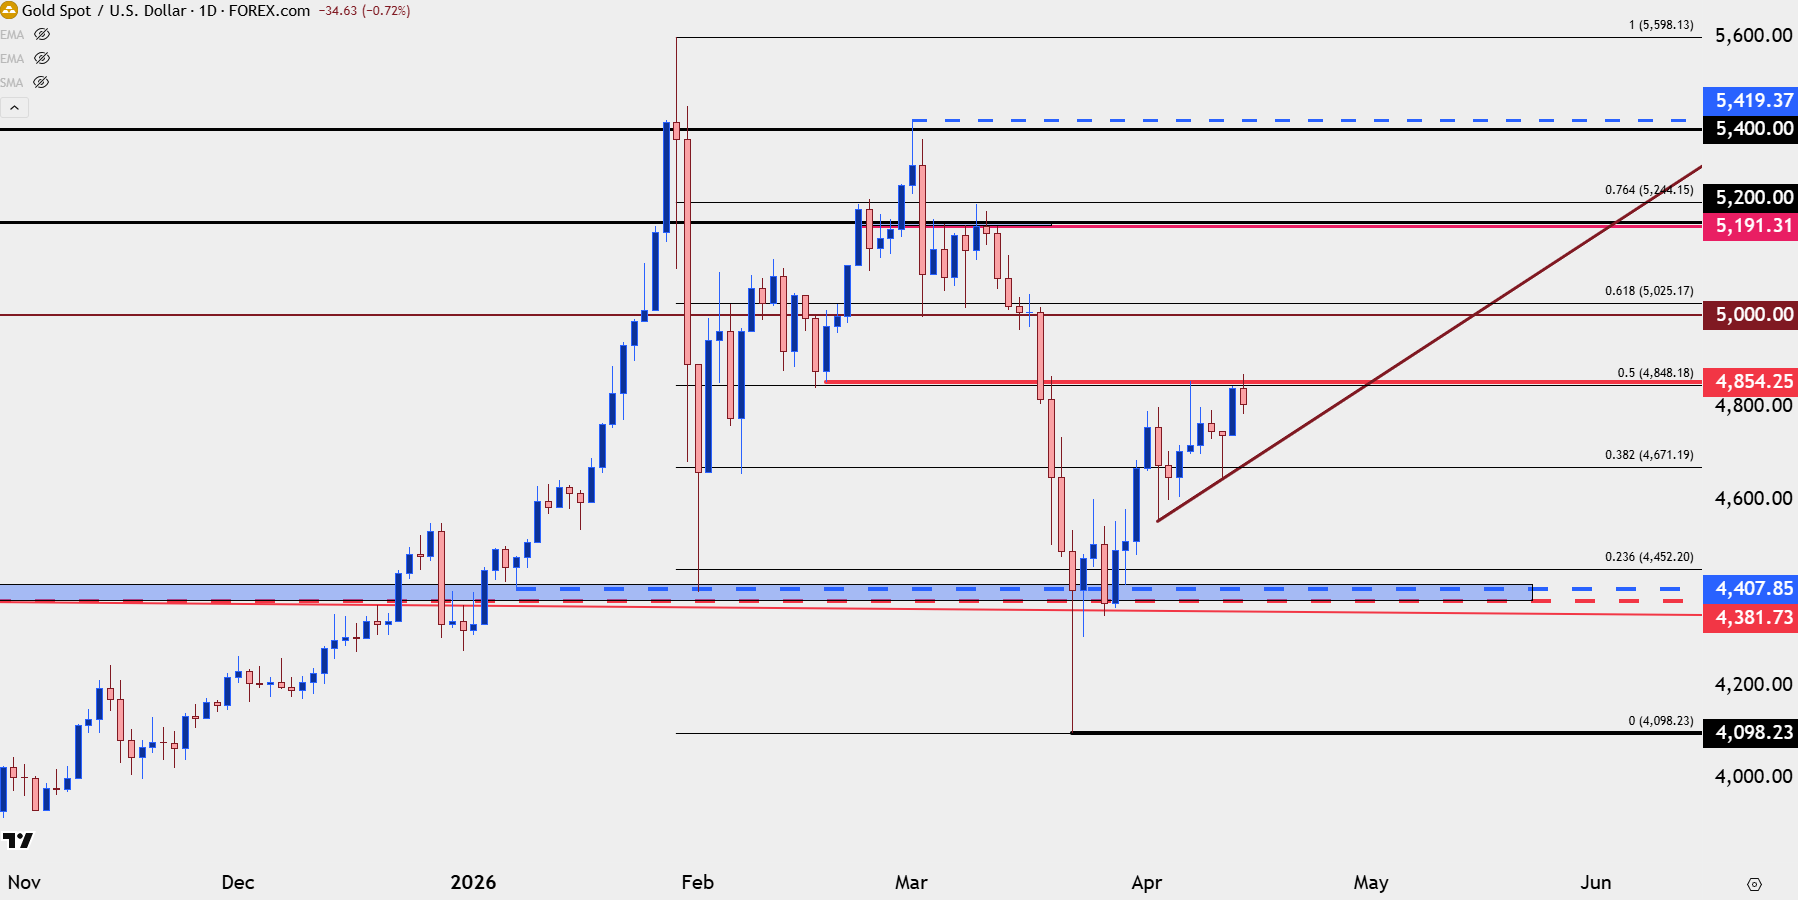
Chart prepared by James Stanley; data derived from Tradingview
Gold Structure
Shorter-term, there’s been a tendency for gold prices to show inflections around psychological levels, illustrated by the resistance hold right around the $4850 level. In yesterday’s webinar, I was tracking support at 4800 and previously, there was resistance-turned-support at both 4600 and 4700.
As of this writing, even 4800 seems to be in play with prior resistance now showing as near-term support, and if buyers can hold on to that, the door remains open for the breakout to test beyond 4850 with 4900 the next obvious spot to follow above current highs.
Gold Four-Hour Chart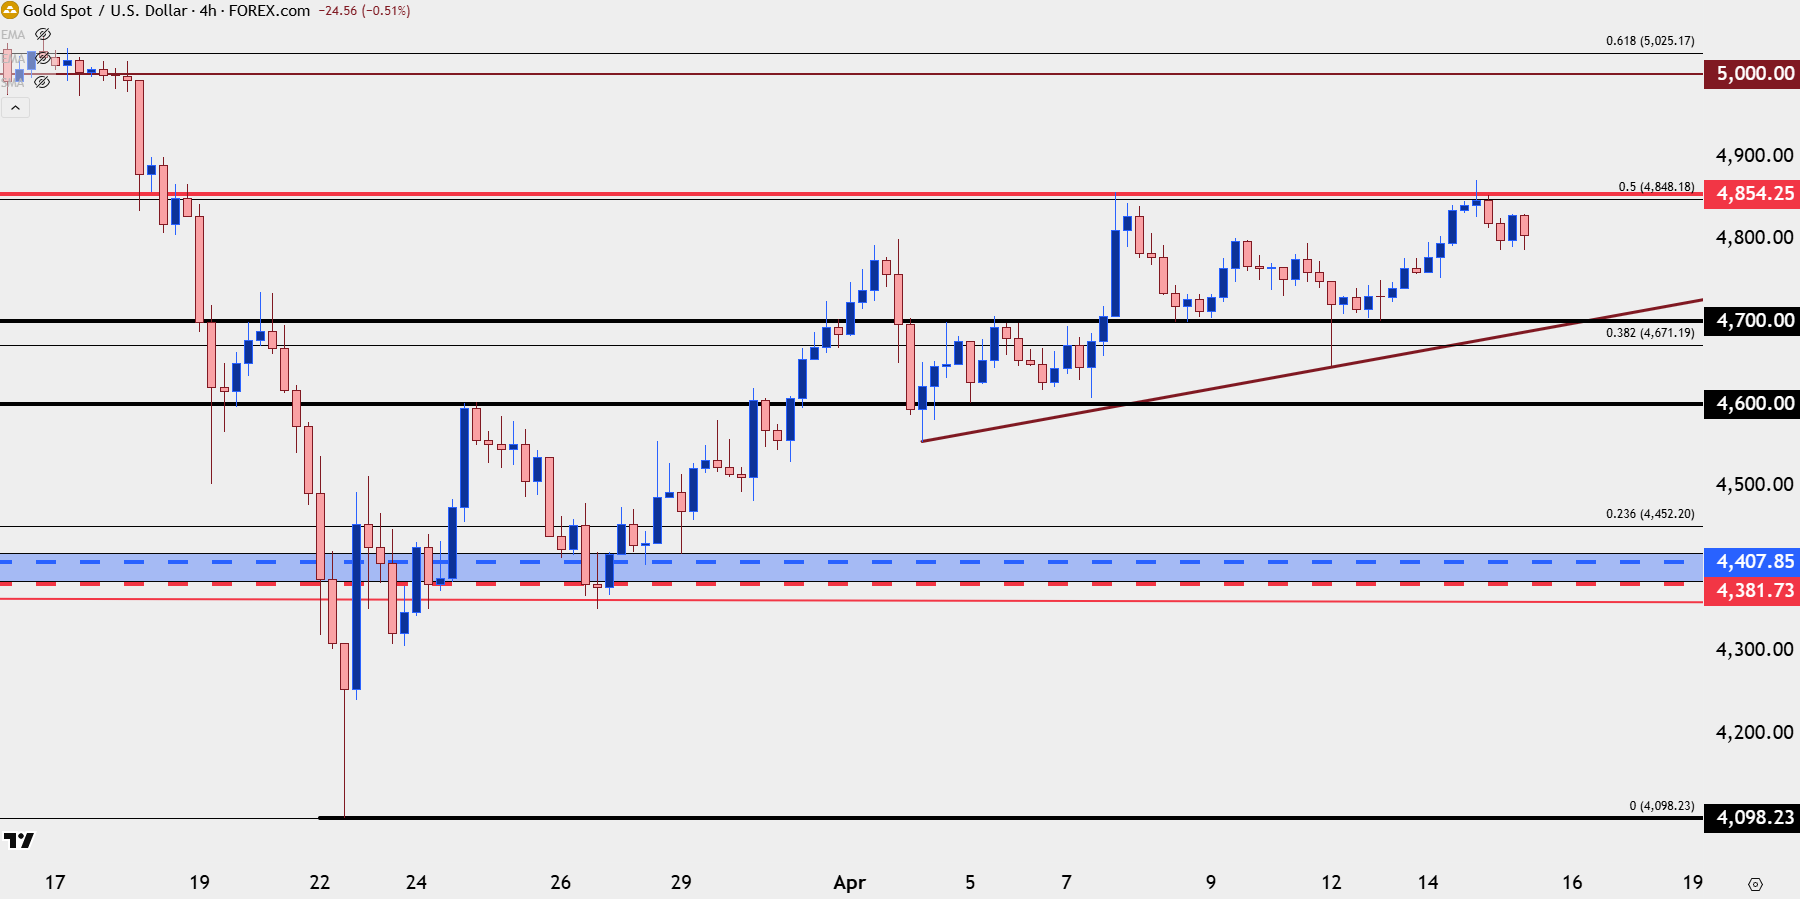
Chart prepared by James Stanley; data derived from Tradingview
Gold: Why $5k is So Important
As evidenced by the inflections at psychological levels, a price like $5,000/oz carries a lot of weight, as this is something that non-traders will take notice of and, in turn, this can inspire action that could inevitably contribute to whether the price plays at support or resistance.
The test above $5k so far was brief on both accounts, but in each, sellers came in and slammed the market down until buyers eventually came in at $4400 in February and then $4100 in March. The rally since the doji three weeks ago, however, has been consistent with buyers coming in at increasingly higher-lows, and this keeps the door open for another test of that $5k level.
But what will likely determine directional trajectory is whether that $5k re-test brings more sellers in from the sidelines or whether bulls show even more acceptance of that price, similar to what we saw after the $4400 pullback in February.
For now, there’s a bullish trend to work with but whether that can turn into a longer-term, bigger picture move, will likely revolve right back to how bulls treat the $5k price on a subsequent re-test.
Gold Weekly Price Chart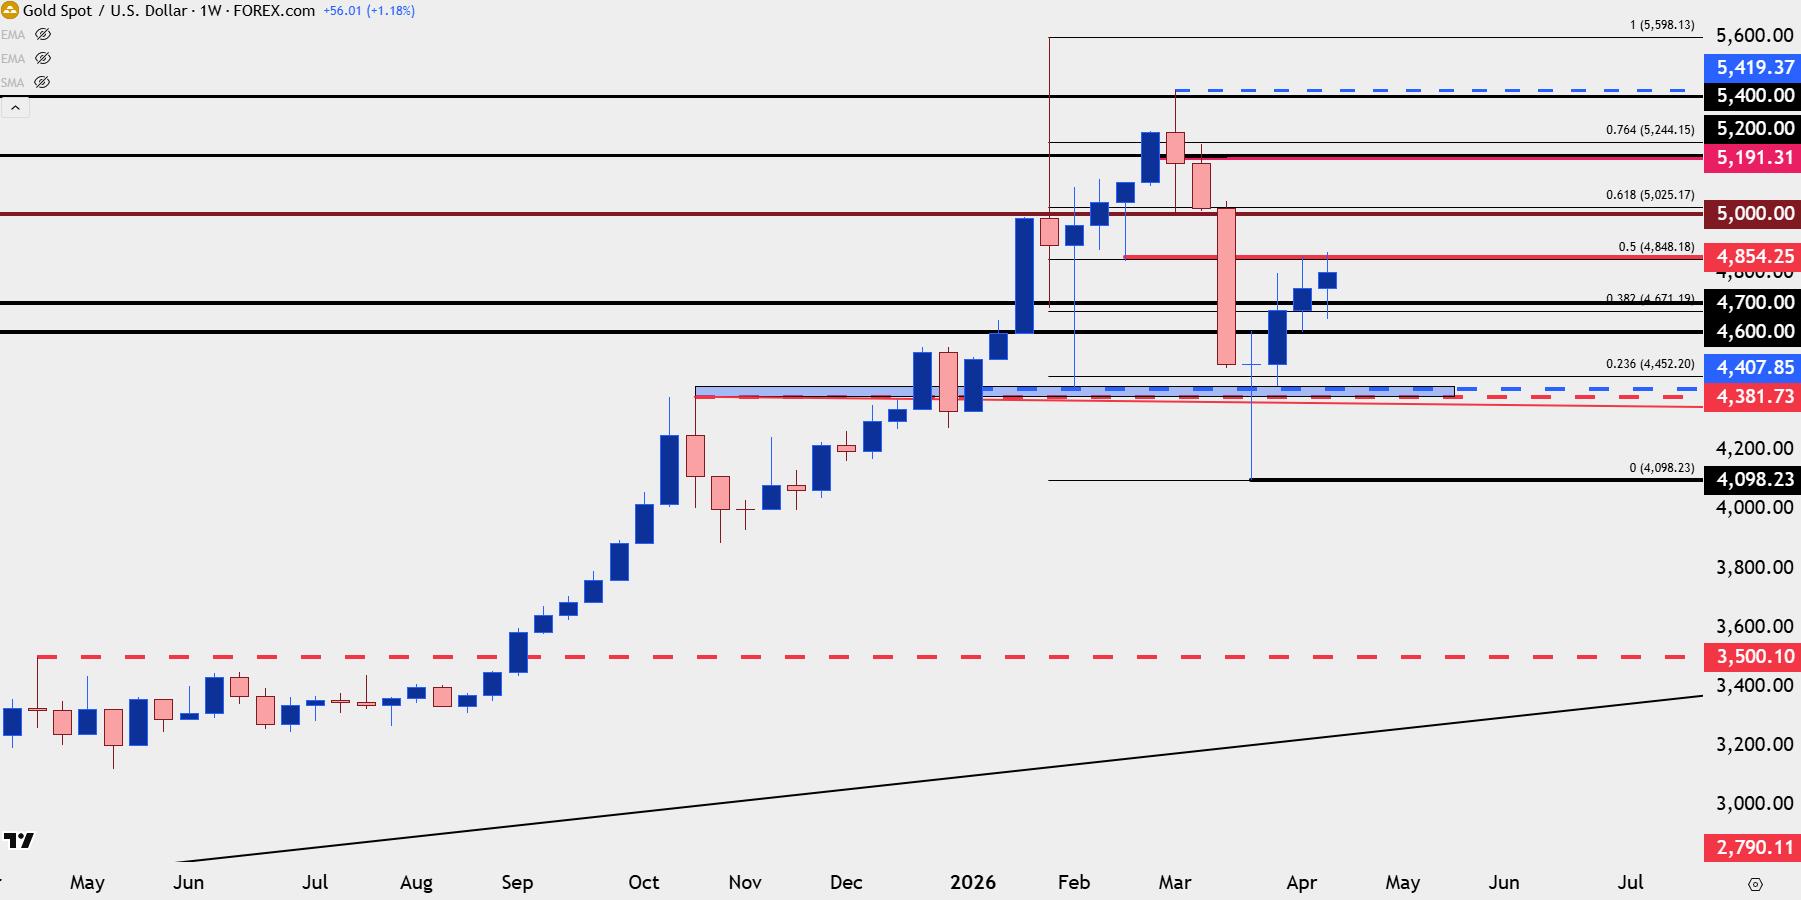
Chart prepared by James Stanley; data derived from Tradingview
--- written by James Stanley, Senior Market Analyst, Global Macro






