Key Events
- Haven demand has dominated headlines and market risk appetite since late December, driven by escalating geopolitical frictions amid the start of a second, unpredictable year under Trump’s second term.
- Silver’s exponential surge towards the $80 mark sent shockwaves across markets, lifting gold prices modestly before consolidating below the $4550 mark. US employment and geopolitical developments are next in line for potentially reviving the market’s recent muted activity.
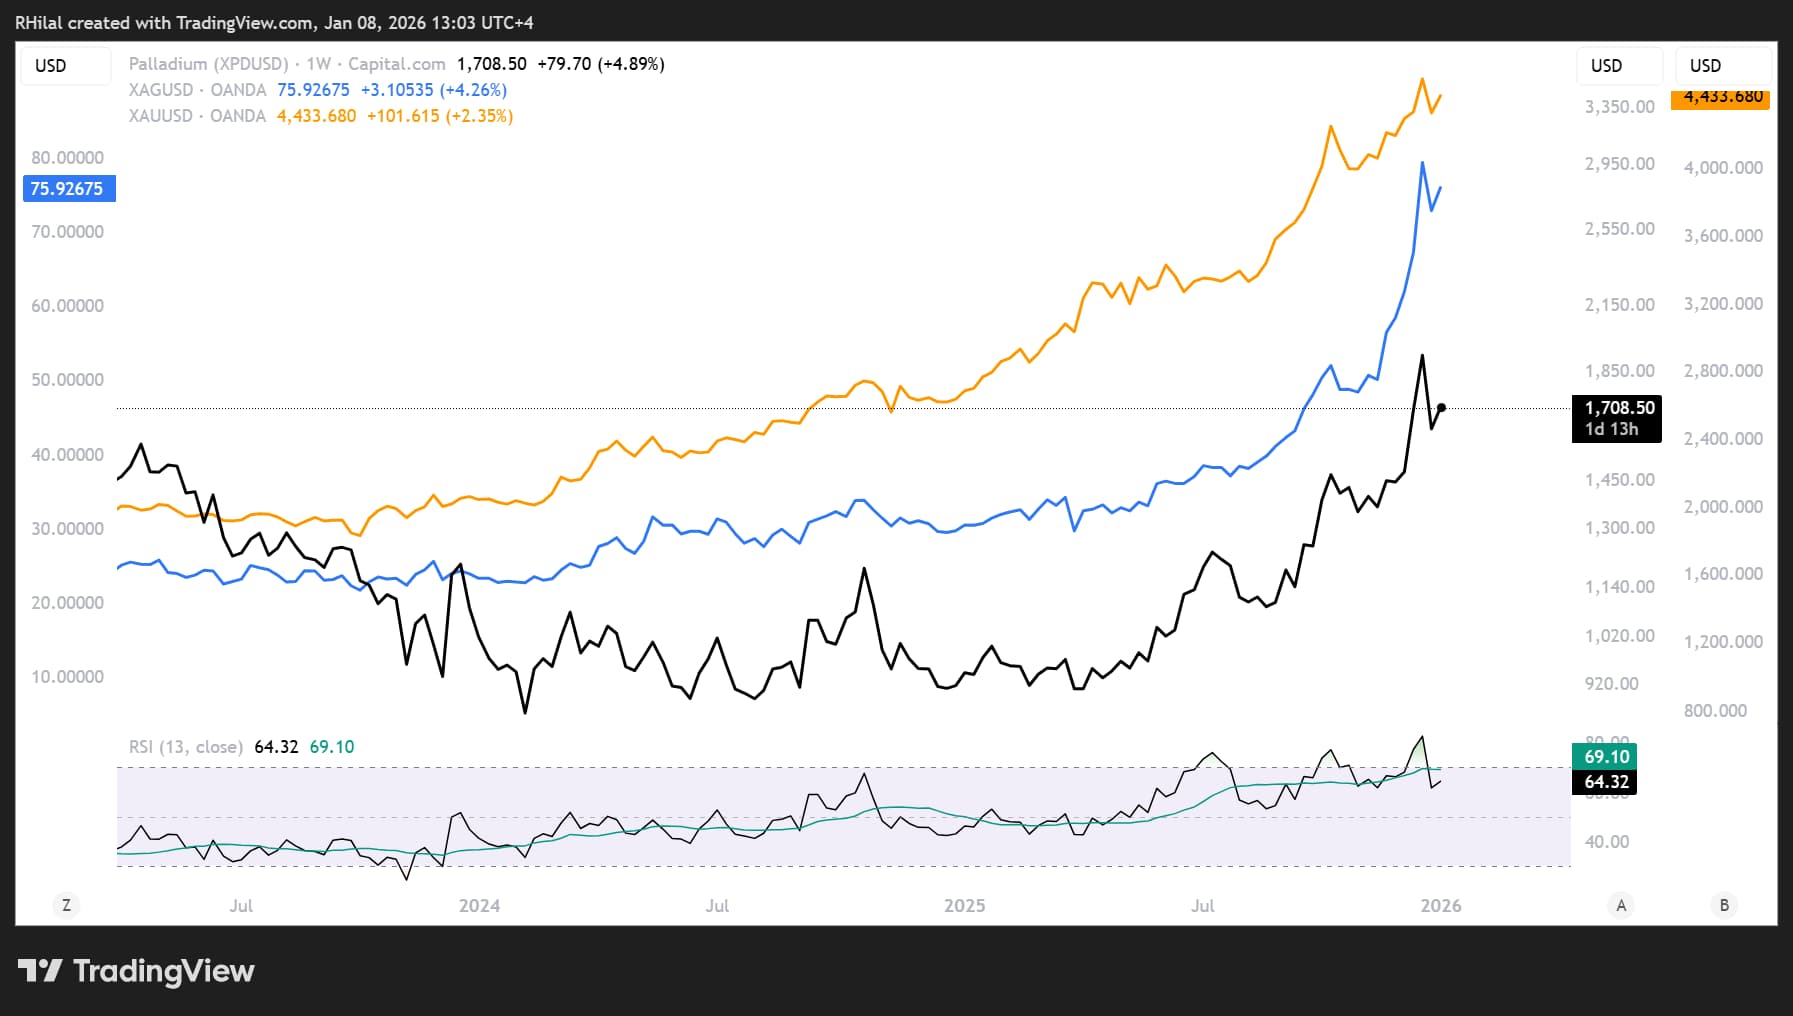
Gold, Silver, Palladium Outlook: Weekly Time Frame – Log Scale
Source: Trading view
The exponential run across precious metals (notably silver, palladium, and gold) appears to be slowing after absorbing thin holiday liquidity and geopolitical worries. This moderation comes amid early-2026 geopolitical tensions involving the US, Venezuela, and Greenland, with broader implications for allied relationships.
The EU’s opposition to US statements regarding Greenland, alongside renewed US–China frictions linked to Venezuelan tensions, risks elevating market uncertainty further, reinforcing risk aversion and haven demand.
US–Greenland frictions have also increased appetite for defense stocks, alongside gold, silver, and palladium. A broad market pause is visible, with the Dow Jones standing out as the only major index showing early-2026 upside momentum, ahead of Friday’s employment data.
Meanwhile, the US dollar is testing an inflection point between long-term (17-year) support and dovish policy expectations under Trump’s presidency, relative to a more stable ECB policy outlook, continuing to support precious metals.
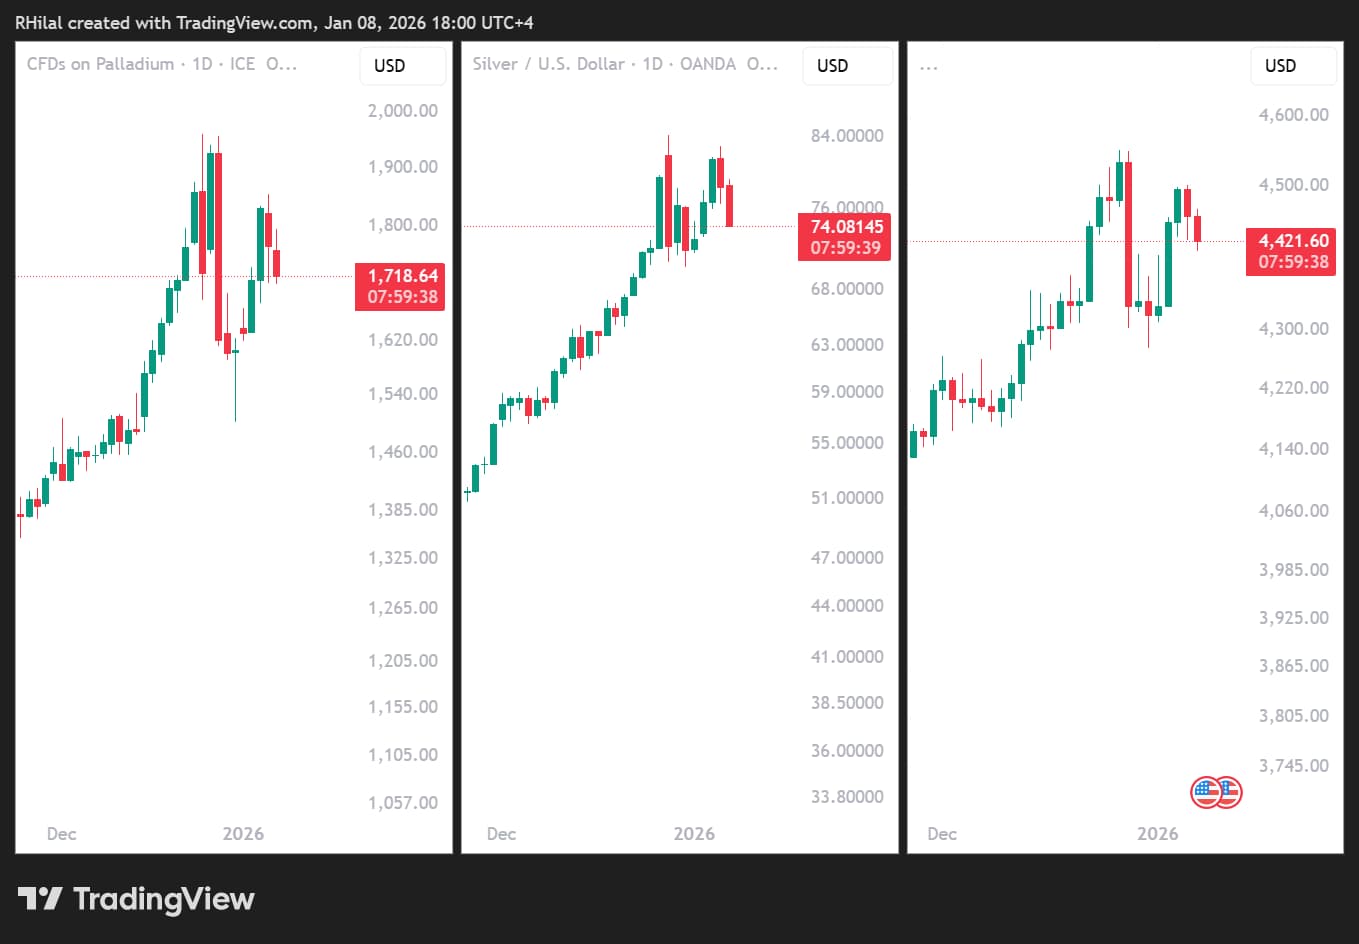
Palladium, Silver, and Gold: Daily Time Frame – Log Scale
Source: Trading view
Following the recent slowdown after record highs, several key technical patterns are emerging, pointing to near-term volatility risks.
From a daily perspective, double-top risks are visible across metals, with:
- Palladium pulling back from 1,961
- Silver retreating from 83
- Gold easing from 4,550
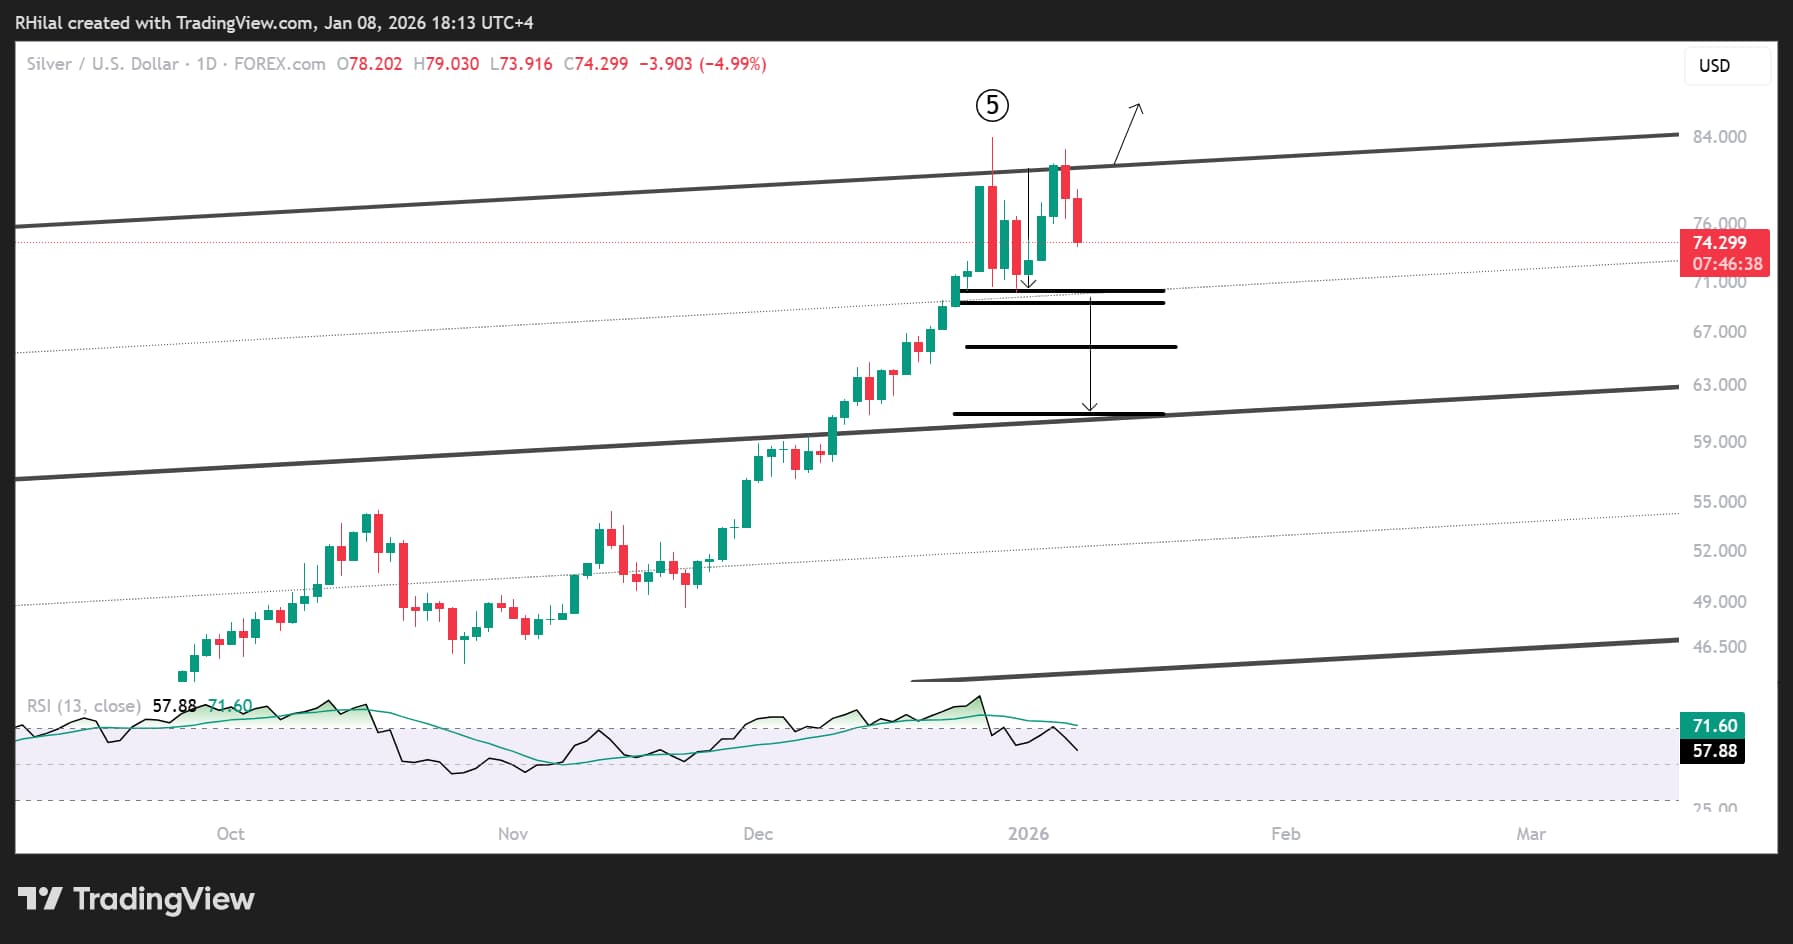
Silver outlook: Daily Time Frame – Log Scale
Source: Trading view
Silver continues to lead. In line with the daily RSI dipping below its moving average and exiting the overbought zone, last seen in October before silver’s 16% correction, double-top risks are forming below the $80 barrier, with a key neckline at $69.
Should silver close below $72 and $69, a double-top retracement could extend toward $65 and $60, aligning with the 100%, 127%, and 168% extensions of the pattern measured between:
- Dec 29, 2025 high: 83.90
- Dec 30 low: 70.00
- Jan 2026 high: 82.75
Such a move would likely present another dip-buying opportunity, supported by both haven and industrial demand.
On the upside, a bullish resolution with a daily close above $83 would reopen the path toward triple-digit levels near $100, potentially lifting broader metal sentiment amid rising geopolitical and financial uncertainty.
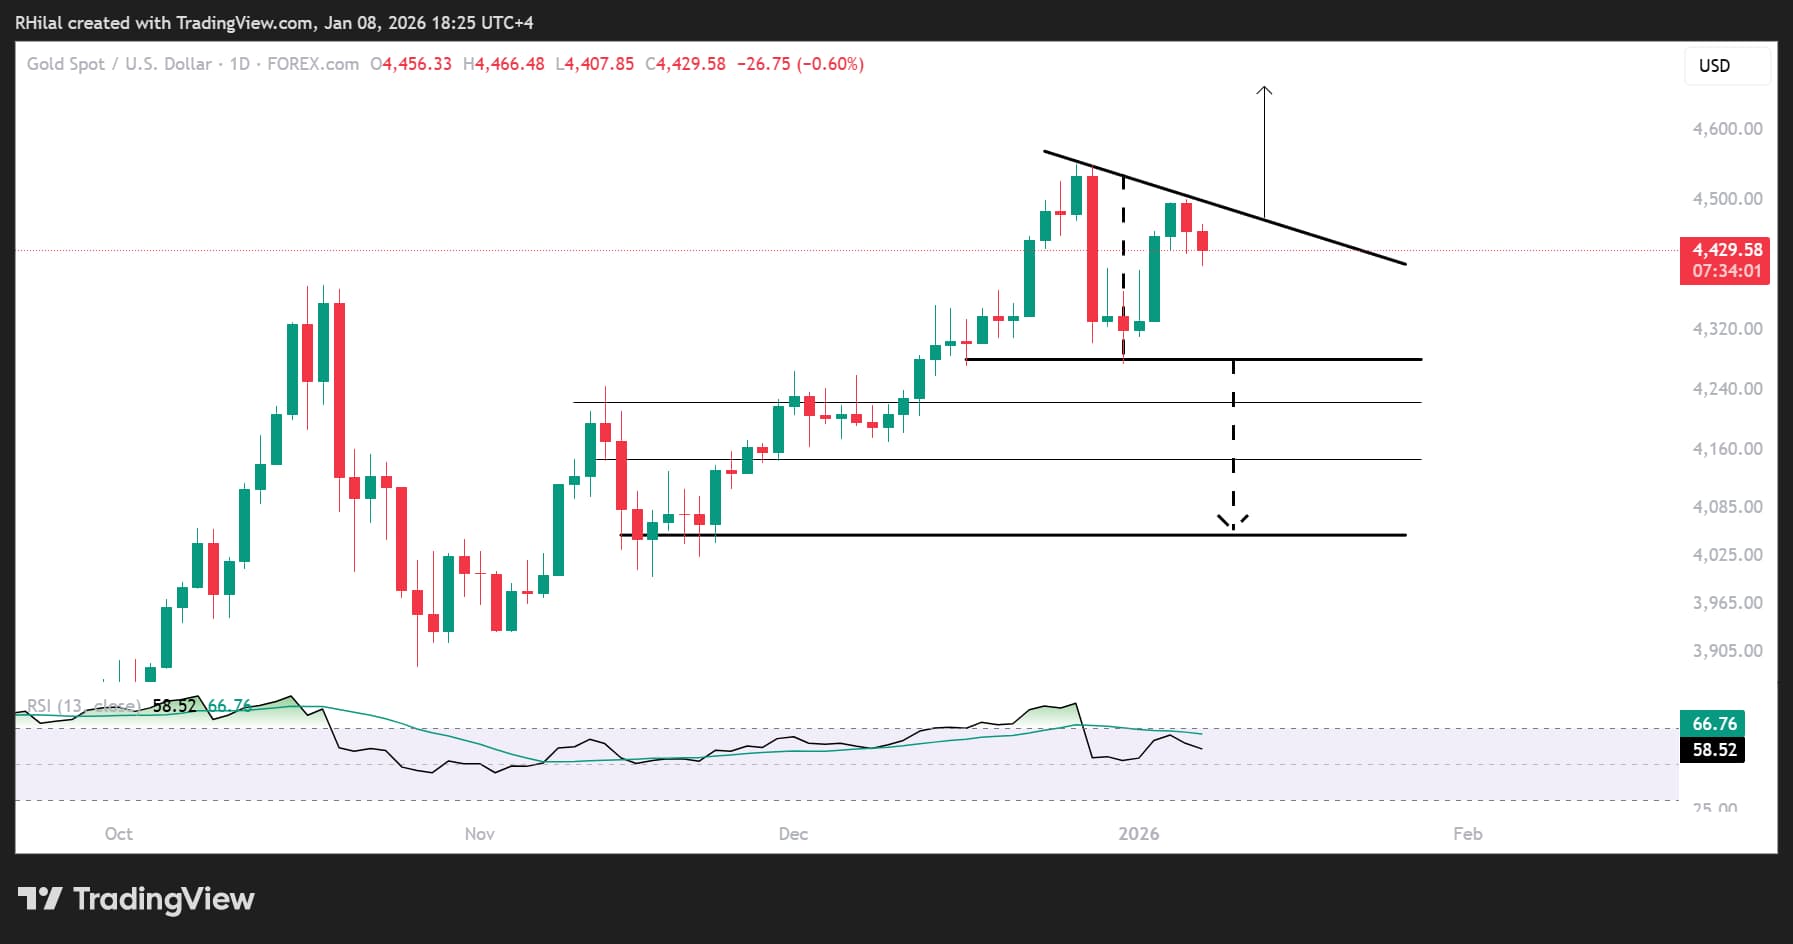
Gold Outlook: Daily Time Frame – Log Scale
Source: Tradginview
In line with silver’s consolidation, gold is tracing either a consolidation pattern or a potential double top below the 4,550-mark, with a key neckline near 4,270. A break below this level would expose downside targets at 4,150 and 4,050, potentially offering another strategic dip-buying opportunity.
Conversely, a renewed push above 4,550 would align with broader market consensus toward the 5,000 level, likely supported by a weaker dollar or increased haven demand amid the uncertain geopolitical start to 2026.
Written by Razan Hilal, CMT
Follow on X: @Rh_waves