


Japanese Yen Talking Points:
- USD/JPY has rallied above the 148.00 level which is a resistance zone that’s been in-play since early-Q2 trade.
- USD-strength has been notable to start this week and there’s a heavy batch of drivers in the latter-half of the week. That USD-strength has shown a larger pullback in EUR/USD which has also impacted EUR/JPY, looked at in greater detail below.
USD/JPY opened last week with a sell-off driven by results of the election news that hit over the weekend. USD/JPY continued to sell-off in the early part of the week, all the way until the support level at 145.92 came into play on Thursday morning. And even before that, there was a softening in the sell-off on both Tuesday and Wednesday with the price trading early on Thursday, which then led to a strong reaction and a continuation of that strength on Friday.
To start this week, USD-strength has been quite notable especially against the Euro following the news of a trade deal between the U.S. and EU, and that has led to a large retracement in EUR/USD. Correspondingly, that Euro weakness has also shown against the Japanese Yen even though the JPY has been weak against the USD. This illustrates the power of major FX pairs and in USD/JPY, bulls have an open door to make a push.
There is a plethora of resistance sitting overhead. The 148.65 level is a prior high and then the July high plots at 149.19, which likely came into play as bulls shied away from a test of the 200-day moving average around 149.60, which is then followed by the 150.00 psychological level.

USD/JPY Daily Price Chart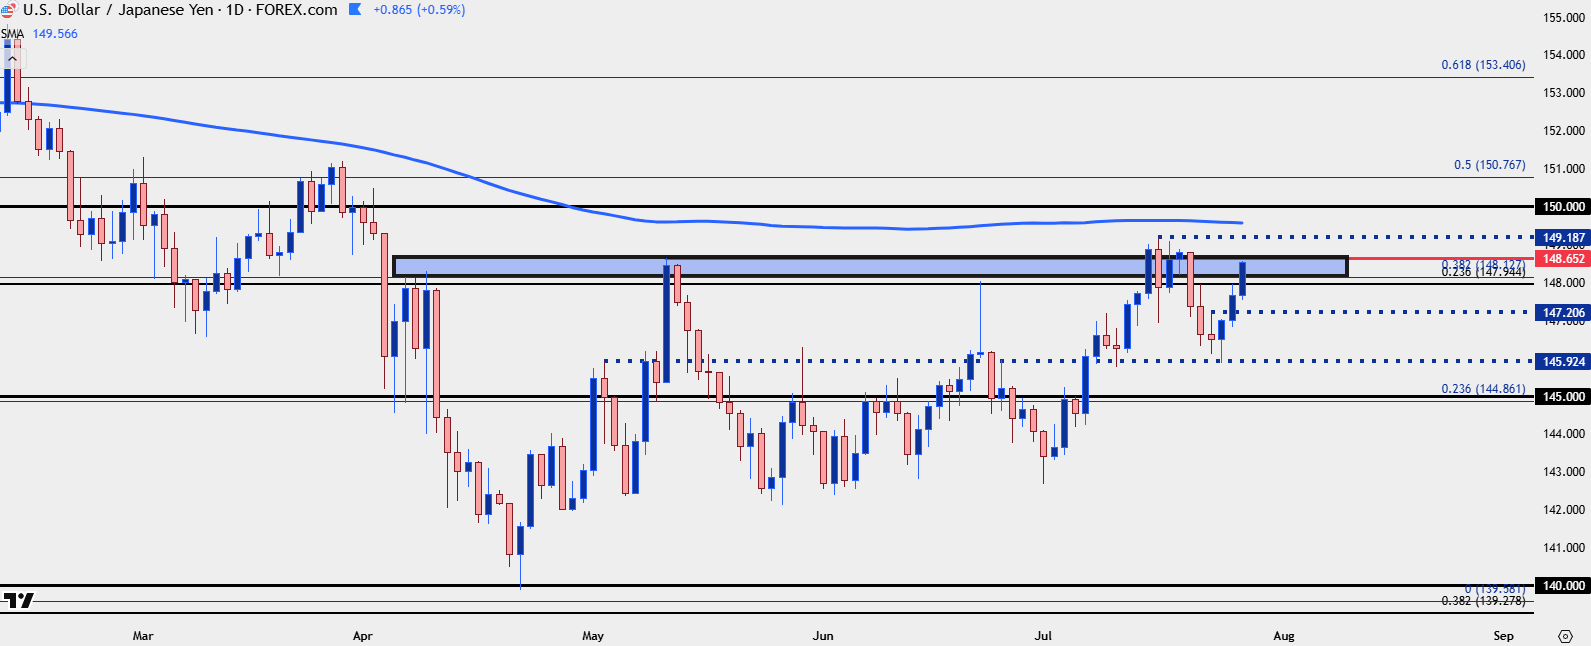
Chart prepared by James Stanley; data derived from Tradingview
In the Tuesday webinar I looked at 147.94 as a resistance level and this has so far played rather cleanly, marking the high on Friday and then again shortly after this week’s open. And then after price broke out, that level has since come back in as higher-low support.
This highlights the 148.13 level as another level of interest for higher-low support, and if we do see bulls press the break up for a re-test of 149.19, then 148.65 could come into the picture for a similar purpose.
USD/JPY Four-Hour Price Chart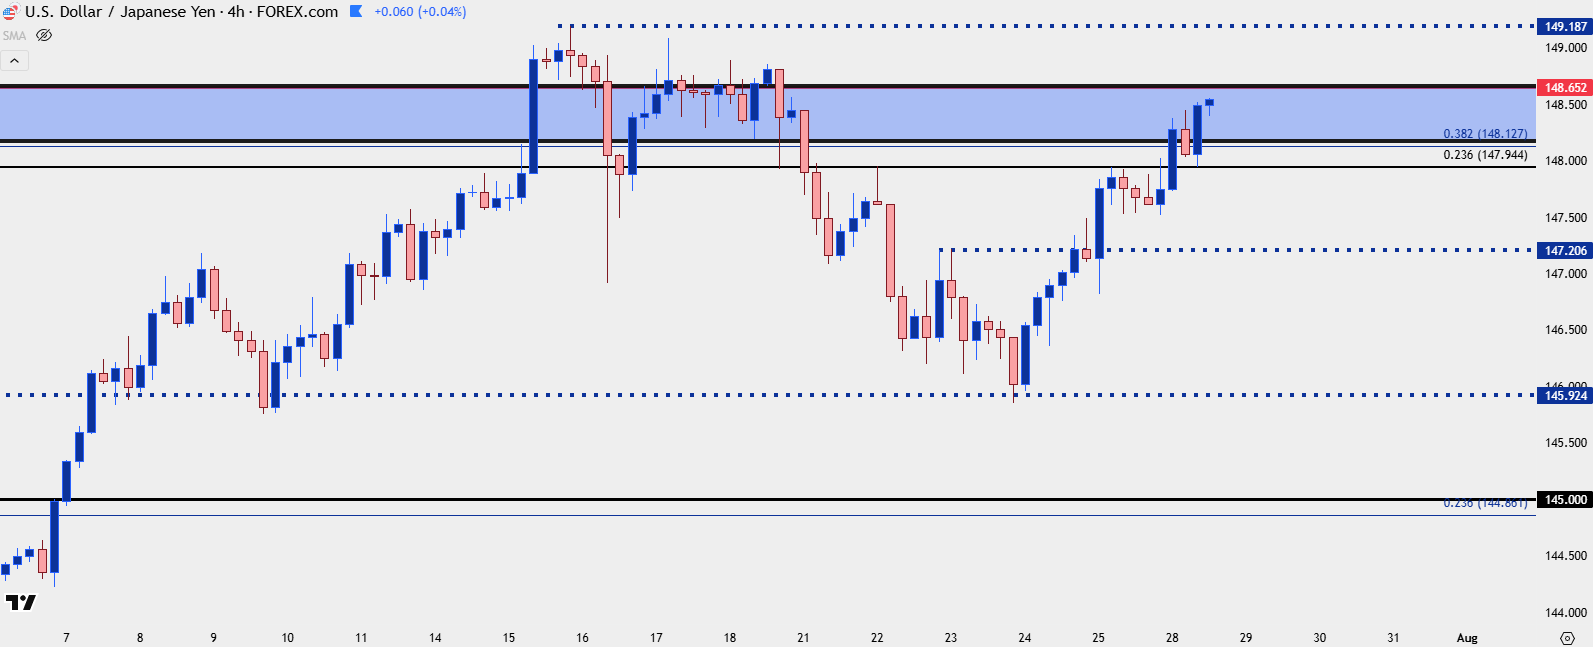
Chart prepared by James Stanley; data derived from Tradingview
EUR/JPY
EUR/JPY has been in a high-flying trend as last week showed overbought RSI on both daily and weekly charts. I’ve largely been of preference for GBP/JPY for JPY-weakness scenarios of late and that overbought nature of EUR/JPY is one of the reasons as to why. When those conditions come off, the pullback or reversal can be massive.
That said, it’s still early, although the daily chart is now working on a bullish engulfing candlestick. This highlights support levels at 171.78 and a bit deeper, around 170.47 and 170.93.
As addressed in the video, the fact that JPY has been weak against the USD but strong against EUR/JPY illustrates the importance of majors pairs and the dominance of that move in EUR/USD. This also highlights the fact that a continued run of USD-strength could be a hindrance for EUR/JPY bulls. On a shorter-term basis, there could even be pullback potential, if we do see sellers come in to defend lower-highs around prior short-term support of 172.55.
EUR/JPY Daily Chart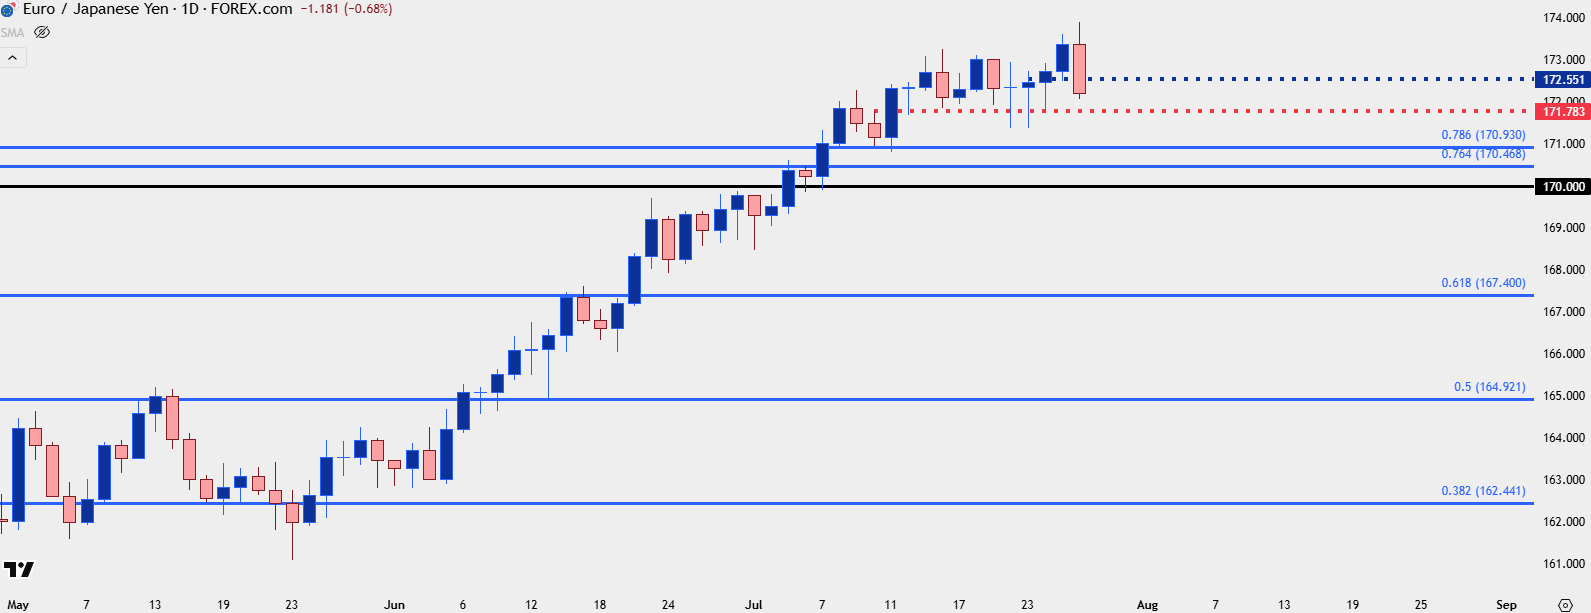
Chart prepared by James Stanley; data derived from Tradingview
GBP/JPY
While EUR/JPY is down on the day GBP/JPY is holding right near where it had opened. The past three weeks have been very range-bound for the pair, with bulls shying away from the 200-handle by just 2.5 pips which helps to explain the recent pullback. But – since that pullback which ran through last Tuesday in GBP/JPY, there’s been higher-lows on the daily, and I think this could keep the pair situated for JPY-weakness scenarios. At this point, it’s the same support structure, around 198.08, that remains of interest.
GBP/JPY Daily Price Chart
Chart prepared by James Stanley; data derived from Tradingview
--- written by James Stanley, Senior Strategist






