


Nasdaq 100 Lags Dow Jones: Divergent Signals Among Nvidia, Apple, Meta
Nasdaq momentum fades as the Dow strengthens. Nvidia weakens, Apple holds firm, and Meta looks oversold — signalling a shift in market leadership.
Share this:

The Nasdaq 100 is beginning to lag behind the Dow Jones, reflecting a clear rotation from growth into value and defensives. Semiconductor momentum is cooling, Apple continues to attract dip-buyers, and Meta has fallen sharply into oversold territory. Together, these moves suggest a shifting market dynamic that could define the Nasdaq’s next leg — whether it’s a pause before new highs or the start of a broader pullback.
View related analysis:
View related analysis:
Nasdaq 100 Ratio Analysis
The rise of semiconductor stocks such as Nvidia, AMD, Broadcom and TSMC has been a key driver behind the Nasdaq’s AI-fuelled rally. Valuations for these companies have arguably been stretched for some time, but we now appear to be at the stage where hardware revenue growth is already more than priced in.
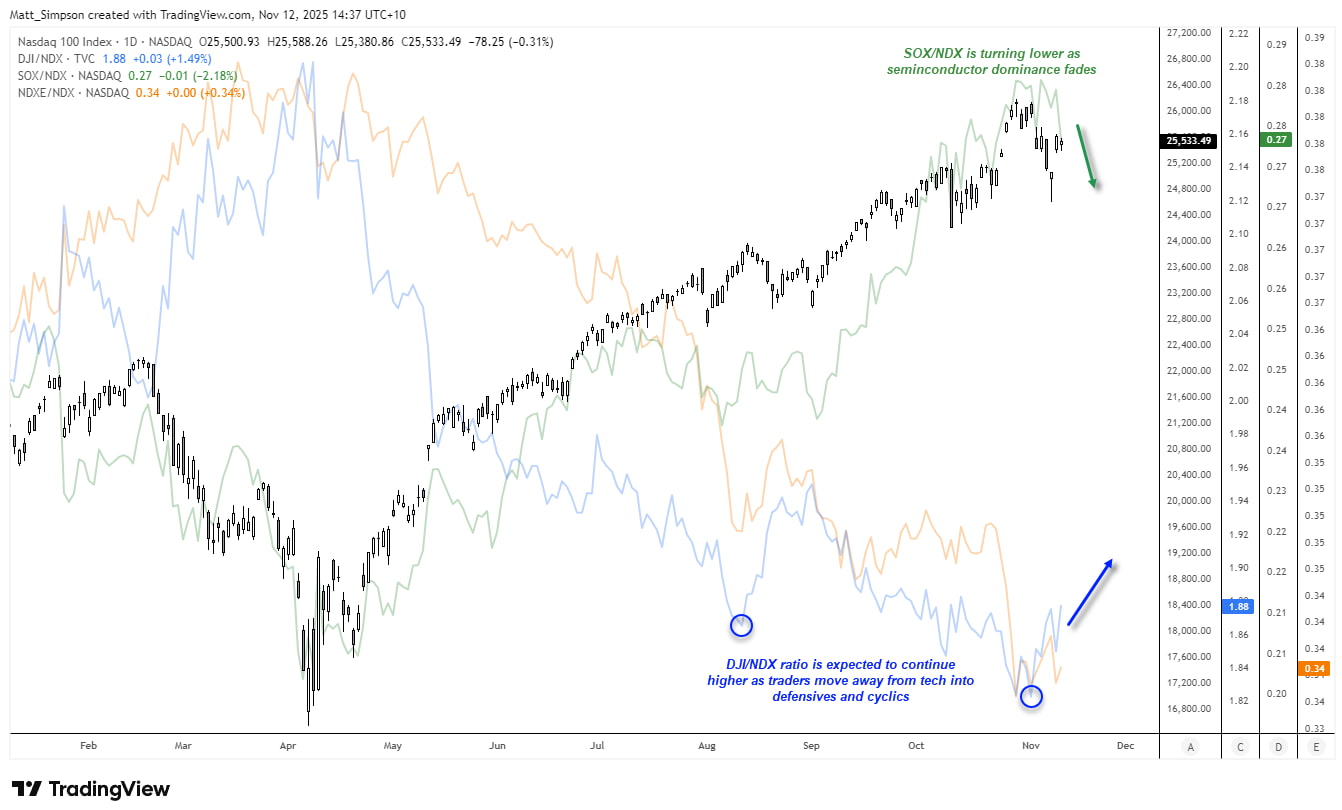
Chart analysis by Matt Simpson - data source: TradingView
It’s therefore notable that the Philadelphia Semiconductor Index (SOX) to Nasdaq ratio has turned lower alongside the Nasdaq itself. That makes sense — the tech sector’s main growth engine is starting to sputter. Should this ratio continue to weaken, the Nasdaq is likely to underperform if Wall Street indices keep rising, or lead the downside in a correction.
The Nasdaq 100 Equal-Weighted Index (NDXE) to Nasdaq ratio (NDXE/NDX) also continues to trend lower, underscoring that the recent Nasdaq advance has been powered by only a handful of heavyweights — not the hallmark of a robust bull market.
Meanwhile, the Dow Jones / Nasdaq ratio (DJI/NDX) is turning higher from historically low levels. This signals rotation out of the tech sector and into value, defensives and cyclicals, marking a broader reallocation away from high-growth names.
It’s also worth noting that the Dow Jones is on the verge of a bullish breakout. The Nasdaq may gain a temporary tailwind from that, but it’s more likely to lag behind — suggesting the DJI/NDX ratio will continue to climb.


Nasdaq 100 Correlations
The positive correlation between the S&P 500 and Nasdaq 100 remains strong across the 10-, 20- and 60-day periods, reflecting broad market alignment. However, the relationship with the Dow Jones has weakened on the shorter time frames, suggesting a gradual rotation of capital away from tech and into more value-oriented sectors.
Meanwhile, the Philadelphia Semiconductor Index (SOX) shows a sharp rebound in correlation with the Nasdaq — now at 0.91 over the past 10 days — confirming that semiconductor performance still heavily influences overall Nasdaq direction.
Apple (AAPL), by contrast, continues to move independently, with a notably weak correlation of 0.35 (10-day) and 0.26 (20-day), highlighting a more idiosyncratic price pattern versus the broader tech complex.
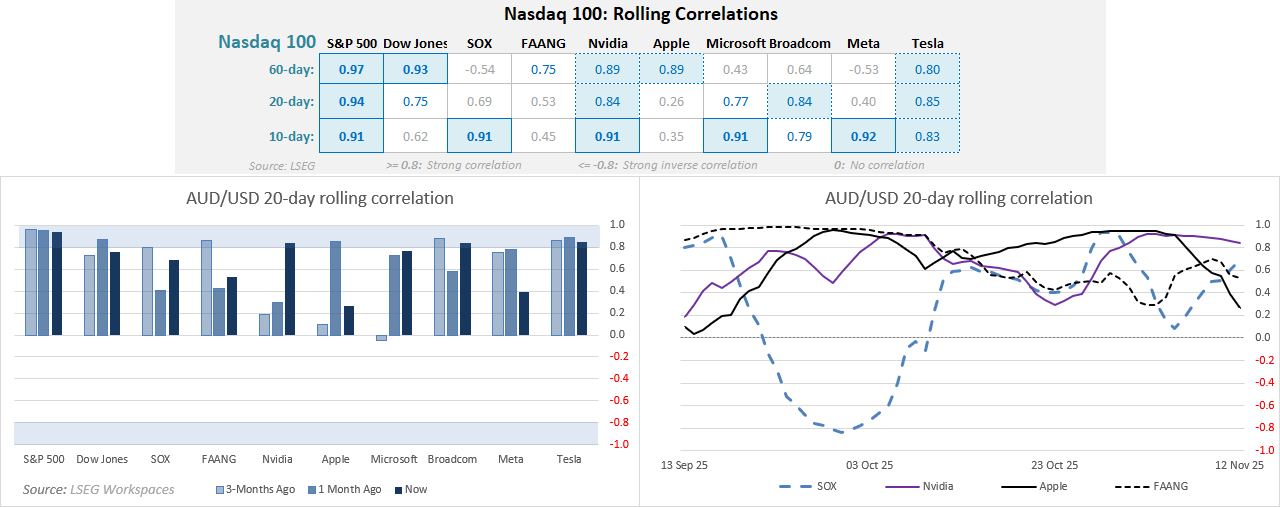
Chart analysis by Matt Simpson - data source: LSEG, NYSE
Nvidia (NVDA) Technical Analysis
We can’t look at the Nasdaq without factoring in Nvidia. A bearish outside week formed last week just below its record high, marking the most volatile week since April’s low. A bearish divergence has also emerged on the weekly RSI (14), warning of potential weakness in the prevailing uptrend. I’m therefore sceptical of the current bounce and suspect that bears may look to fade rallies within last week’s range.
On the daily chart, prices have retraced from the $200 level, though Tuesday’s lower wick suggests that bearish momentum is waning. Buyers may attempt to defend retracements toward gap support near $188.15 for another push higher. For now, the bias is for the rally to stall below $210 and retest the $180 handle near the $177.76 high-volume node (HVN) — with a break beneath that level bringing the $164 lows into focus.
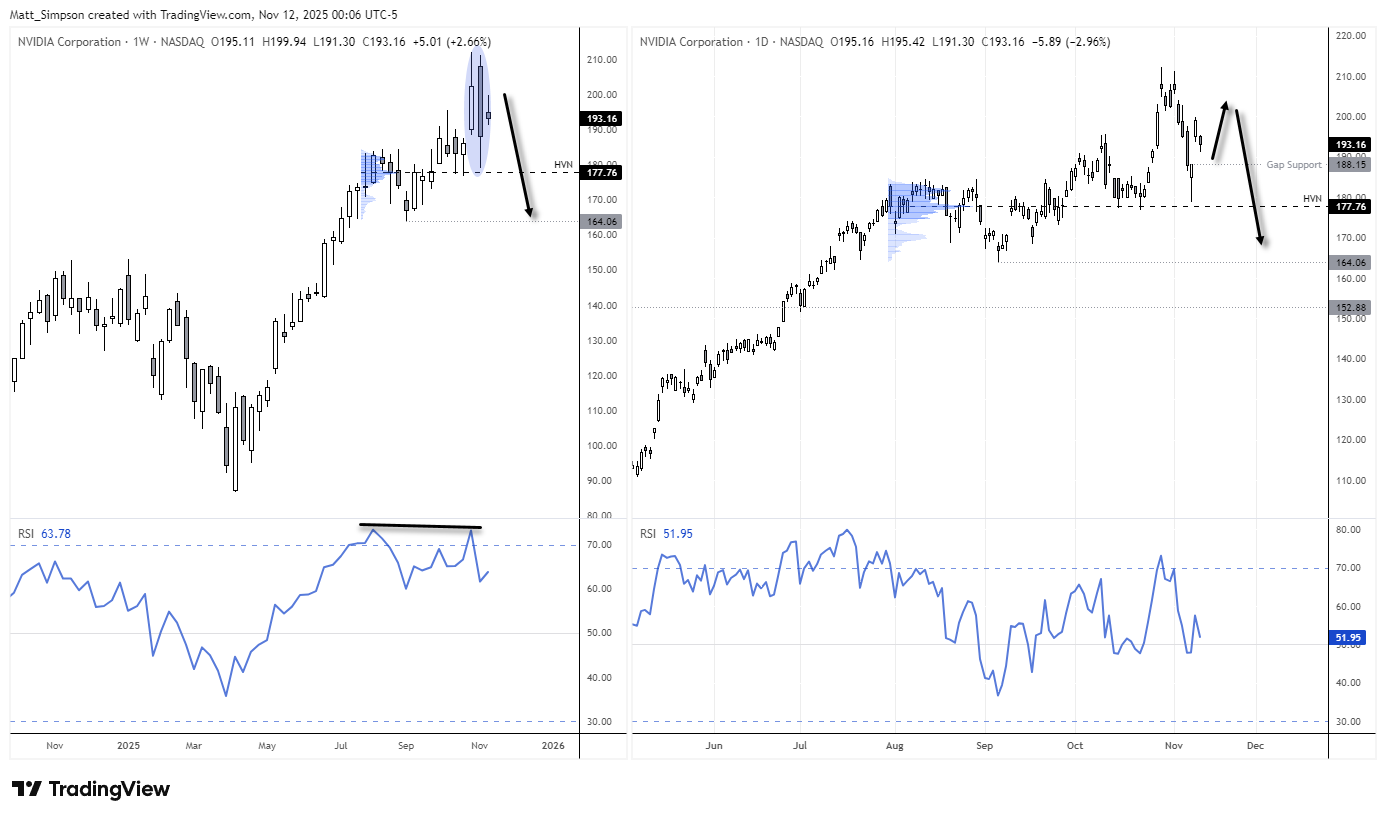
Chart analysis by Matt Simpson - data source: TradingView


Apple (AAPL) Technical Analysis
Apple’s (AAPL) daily chart displays a clean, bullish trend structure, with well-timed swing lows forming around the 10-day EMA. Price action now sits on the verge of a potential breakout to new highs, supported by strong trend alignment across moving averages.
Interestingly, Apple’s decision to scale back AI-related spending appears to be paying off, especially as the market grows wary of excessive AI investment by peers such as Nvidia and Microsoft. As a result, Apple remains firmly on my bullish Nasdaq watchlist, even amid broader concerns of an AI-driven bubble.
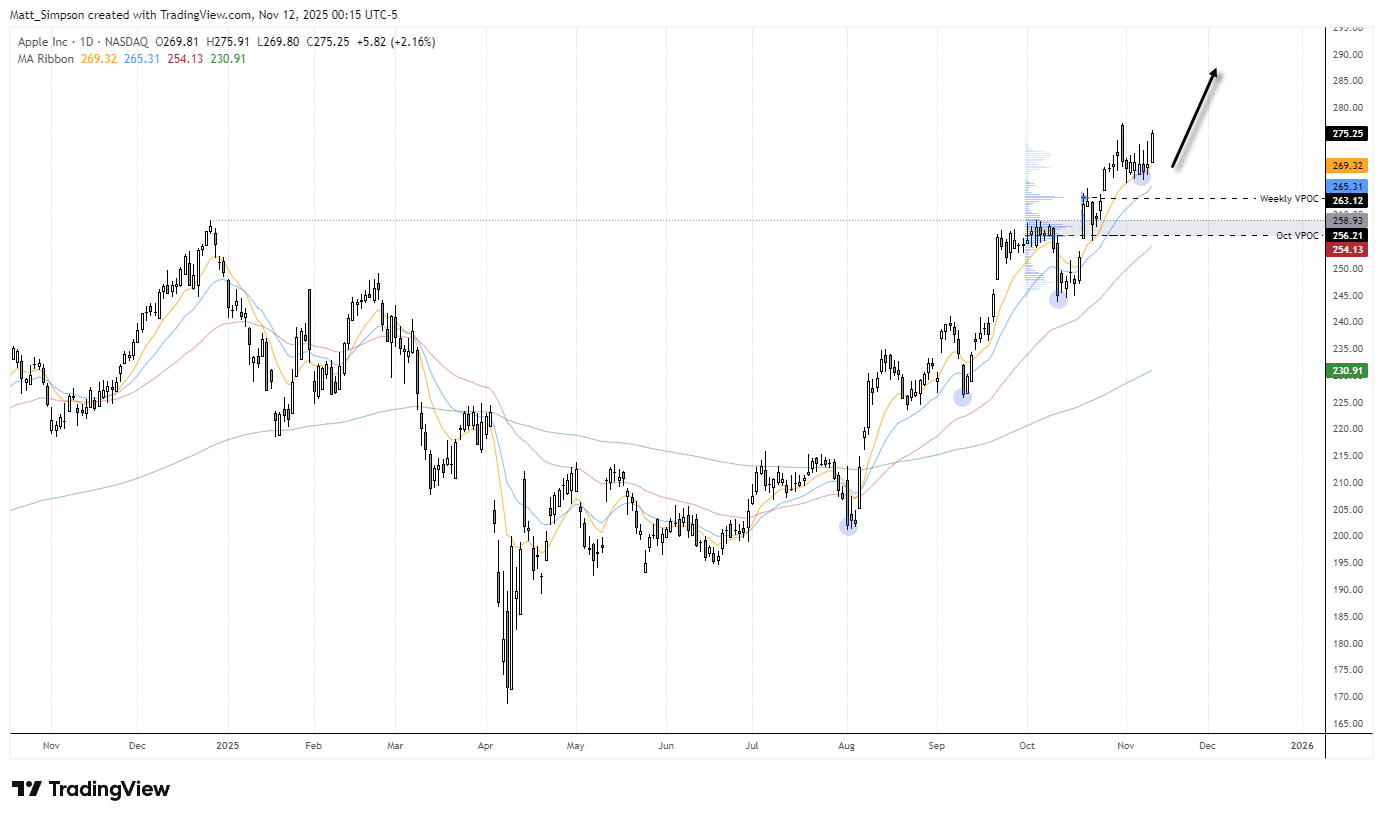
Chart analysis by Matt Simpson - data source: TradingView
Meta (META) Technical Analysis
From a purely technical standpoint, Meta appears oversold in the near term. The stock has fallen 24.5% from its August high, with 20% of that decline occurring in the past week — half of which came from a single large gap lower.
However, bearish momentum is clearly easing. The daily RSI (2) plunged to an extremely oversold level of 1 last week, just before a bullish hammer formed near gap support, the $600 handle, and a high-volume node (HVN). Price has since managed a modest rebound, and the bias remains constructive while prices hold above last week’s low, with scope for a retest of the 200-day EMA near $676.37.
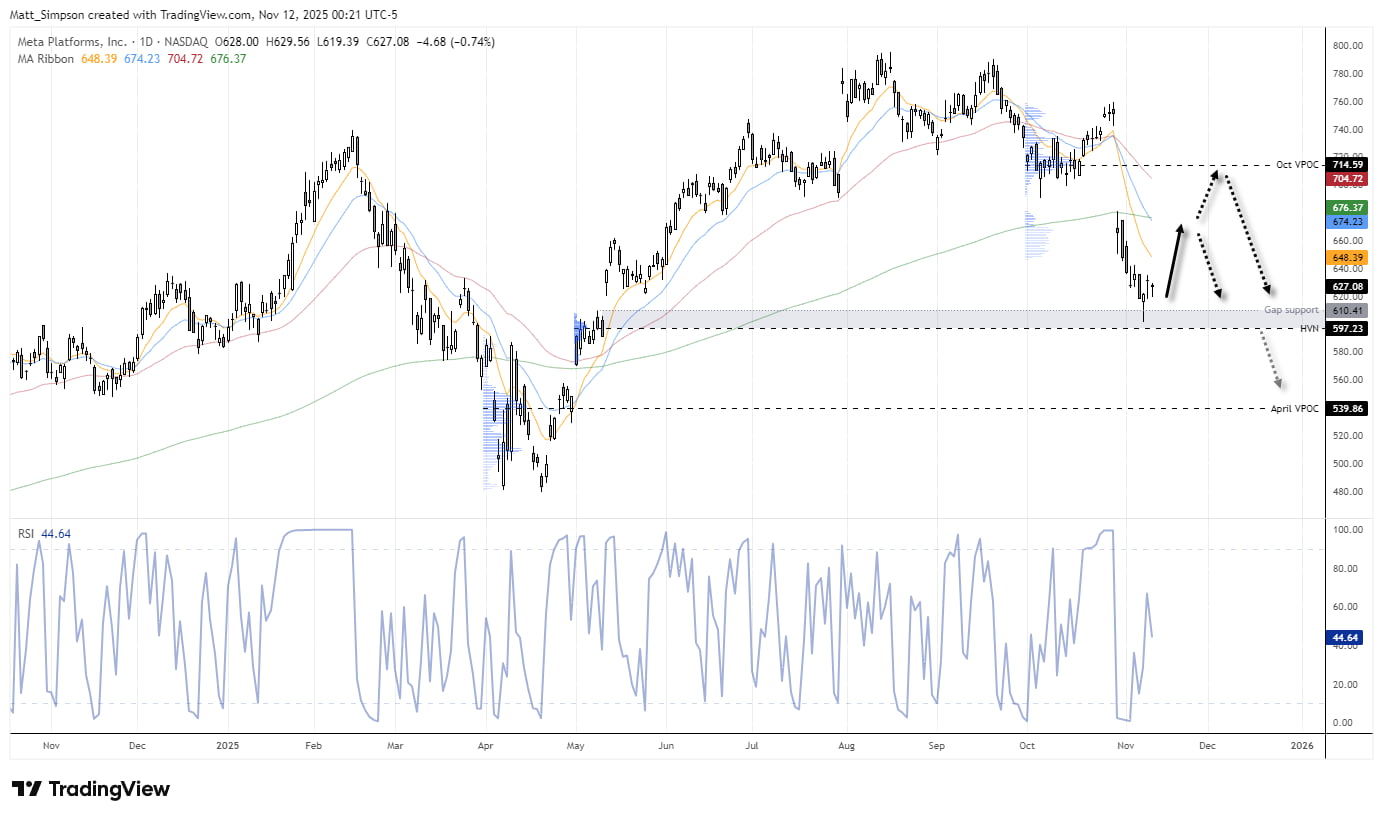
Chart analysis by Matt Simpson - data source: TradingView
View the full economic calendar
View the full economic calendar
-- Written by Matt Simpson
Follow Matt on Twitter @cLeverEdge
How to trade with City Index
You can trade with City Index by following these four easy steps:
- Open an account, or log in if you’re already a customer
• Open an account in the UK
• Open an account in Australia
• Open an account in Singapore
- Search for the market you want to trade in our award-winning platform
- Choose your position and size, and your stop and limit levels
- Place the trade


Open an account in minutes
Experience award-winning platforms with fast and secure execution.
Economic calendar
Web Trader platform
Our sophisticated web-based platform is packed with features.
Related articles
Forex & Gold Outlook: Dollar Dominates, Crosses Diverge
The US dollar rally gathers momentum as forex crosses develop contrasting technical setups. Matt Simpson examines eight FX markets and gold for potential trading opportunities.

Gold Outlook: Asia Buys the Dip, US Hammers the Rip
Asia buys the dip, the US sells the rip. Hourly gold, dollar and Treasury yield data reveal a regional divide that has become especially pronounced since September.


S&P 500, Nasdaq 100 Claw Back But NVDA Cloud Looms Overhead
Last week was green for both the Nasdaq and S&P 500 but given the sell-off that led into that bounce there’s still a very real question as to whether bears still have a statement to make. And the NVDA situation presents a very real threat.

The information on this web site is not targeted at the general public of any particular country. It is not intended for distribution to residents in any country where such distribution or use would contravene any local law or regulatory requirement. The information and opinions in this report are for general information use only and are not intended as an offer or solicitation with respect to the purchase or sale of any currency or CFD contract. All opinions and information contained in this report are subject to change without notice. This report has been prepared without regard to the specific investment objectives, financial situation and needs of any particular recipient. Any references to historical price movements or levels is informational based on our analysis and we do not represent or warranty that any such movements or levels are likely to reoccur in the future. While the information contained herein was obtained from sources believed to be reliable, author does not guarantee its accuracy or completeness, nor does author assume any liability for any direct, indirect or consequential loss that may result from the reliance by any person upon any such information or opinions.
Futures, Options on Futures, Foreign Exchange and other leveraged products involves significant risk of loss and is not suitable for all investors. Losses can exceed your deposits. Increasing leverage increases risk. Spot Gold and Silver contracts are not subject to regulation under the U.S. Commodity Exchange Act. Contracts for Difference (CFDs) are not available for US residents. Before deciding to trade forex, commodity futures, or digital assets, you should carefully consider your financial objectives, level of experience and risk appetite. Any opinions, news, research, analyses, prices or other information contained herein is intended as general information about the subject matter covered and is provided with the understanding that we do not provide any investment, legal, or tax advice. You should consult with appropriate counsel or other advisors on all investment, legal, or tax matters. References to FOREX.com or GAIN Capital refer to StoneX Group Inc. and its subsidiaries. Please read Characteristics and Risks of Standardized Options.