


Nvidia’s (NVDA) near-60% rally could struggle at this resistance zone
Nvidia (NVDA) shares may have rallied 2.7% after their Q3 earnings report, but we’re less convinced it can break above a strong resistance area (initially at least).
Share this:

Nvidia shares rose 2.7% during after-market trade thanks to strong data-centre demand helping them beat analysts Q3 revenue expectations. Earlier in the day they also announced a partnership with Microsoft to build an AI super computer. However, their EPS (earnings per share) was a miss and Q4 revenue guidance was also slightly lower than expected.
Nvidia (NVDA): Bear market rally or new bullish trend?
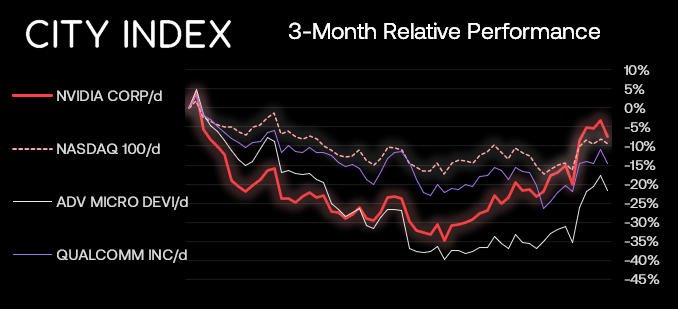
The tech stock peaked in November 2021 at 346.47 and managed to fall nearly 70% over the next 11 months, so its bear trend is more than established. Yet in the past month it has recovered an impressive 57.2%, and that makes us wonder whether this is the beginning of a much larger bull trend, or simply a tease of a bear-market bounce.
I’m happy to let the longer-term investors argue that one over, but I do know that we’re heading into 2023 with a Republican House and Democrat Senate, which means we’re less likely to see inflationary policies make their way over the line (good news to equity traders). But we’re also likely to be seeing much lower growth in 2023 and 2024, and cracks are appearing in the US employment sector data – and many big tech companies have announced layoffs or restructuring plans.
NVIDIA daily chart:
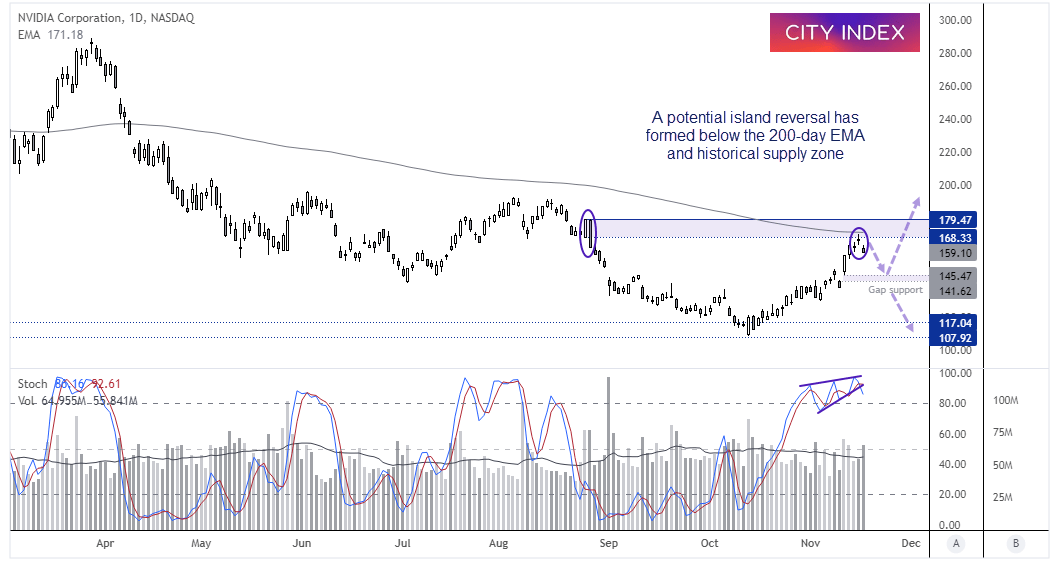
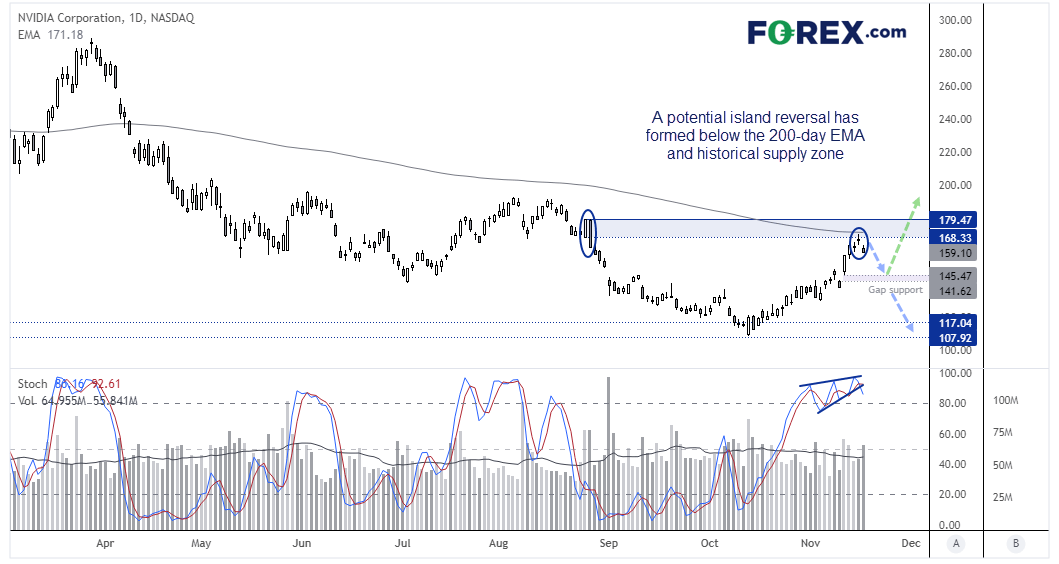
From a technical perspective, I suspect NVIDIA has posted a cycle top. Its rally stalled just below the 200-day EMA, which is a tough mut to crack. A small Doji formed at the cycle high, which is part of a 3-bar reversal called an Island reversal pattern. Furthermore, the reversal pattern is just beneath the prior peak which included a strong 2-bar reversal (and therefore a strong supply zone). Volume was also above average yesterday ahead of earnings and the stochastic oscillator is overbought, which itself is showing signs that it also wants to top out.
- The stock rallied over 2% during after-market hours, but that could allows bears to short at a more favourable prices (assuming resistance holds).
- Bears could enter short below the 200-day EMA with a stop above the 179.47 high.
- Gap support around 141.62 – 145.47 makes a viable downside target which can be trailed along the way.
- As price action unfolds, we may have a better idea as to whether it is a retracement against a much larger bullish move, or the market has returned to the long-term bear trend.
How to trade with City Index
You can easily trade with City Index by using these four easy steps:
- Open an account, or log in if you’re already a customer
• Open an account in the UK
• Open an account in Australia
• Open an account in Singapore
- Search for the company you want to trade in our award-winning platform
- Choose your position and size, and your stop and limit levels
- Place the trade
How to trade with FOREX.com
Follow these easy steps to start trading with FOREX.com today:
- Open a Forex.com account, or log in if you’re already a customer.
- Search for the pair you want to trade in our award-winning platform.
- Choose your position and size, and your stop and limit levels.
- Place the trade.
Related tags:

Open an account in minutes
Experience award-winning platforms with fast and secure execution.
Economic calendar
Web Trader platform
Our sophisticated web-based platform is packed with features.
Related articles

Bond yields and crude call the shots for ASX 200
The ASX 200 has rallied on 93% of occasions this year when Australian three-year bond yields have fallen at least five basis points. With crude prices also plunging, the latest breakout has history on its side.


Gold coils for potential breakout as US CPI looms
Gold's ascending triangle is putting $4,140 firmly in focus ahead of US CPI. With traditional macro relationships offering few clues, the price action may prove more useful for traders.

USD/CAD Outlook: Loonie left behind as US CPI looms
USD/CAD's sharp rebound has coincided with widening US–Canada interest rate differentials. With US CPI approaching and bullish momentum building, another breakout may be on the cards.
The information on this web site is not targeted at the general public of any particular country. It is not intended for distribution to residents in any country where such distribution or use would contravene any local law or regulatory requirement. The information and opinions in this report are for general information use only and are not intended as an offer or solicitation with respect to the purchase or sale of any currency or CFD contract. All opinions and information contained in this report are subject to change without notice. This report has been prepared without regard to the specific investment objectives, financial situation and needs of any particular recipient. Any references to historical price movements or levels is informational based on our analysis and we do not represent or warranty that any such movements or levels are likely to reoccur in the future. While the information contained herein was obtained from sources believed to be reliable, author does not guarantee its accuracy or completeness, nor does author assume any liability for any direct, indirect or consequential loss that may result from the reliance by any person upon any such information or opinions.
Futures, Options on Futures, Foreign Exchange and other leveraged products involves significant risk of loss and is not suitable for all investors. Losses can exceed your deposits. Increasing leverage increases risk. Spot Gold and Silver contracts are not subject to regulation under the U.S. Commodity Exchange Act. Contracts for Difference (CFDs) are not available for US residents. Before deciding to trade forex, commodity futures, or digital assets, you should carefully consider your financial objectives, level of experience and risk appetite. Any opinions, news, research, analyses, prices or other information contained herein is intended as general information about the subject matter covered and is provided with the understanding that we do not provide any investment, legal, or tax advice. You should consult with appropriate counsel or other advisors on all investment, legal, or tax matters. References to FOREX.com or GAIN Capital refer to StoneX Group Inc. and its subsidiaries. Please read Characteristics and Risks of Standardized Options.