


Over the past five trading sessions, NZD/USD has shown a broad bearish bias, accumulating a decline of more than 1% as the Reserve Bank of New Zealand (RBNZ) prepares to announce its next policy decision. For now, the market expects additional rate cuts, which has limited the New Zealand dollar’s ability to regain strength against the U.S. dollar. If the RBNZ continues signaling lower interest rates, short-term weakness is likely to remain dominant in the pair’s movements.
 div>
div>
What to Expect from the RBNZ?
Today, the RBNZ will release its monetary policy decision, and market consensus points to another 25-basis-point cut, bringing the benchmark rate to 2.25%, the lowest level in the past three years. However, the real focus will be on the post-decision statement, as the central bank has maintained a flexible stance since rates peaked at 5.5%, and inflation data may once again take center stage.
Since the start of its easing cycle, inflation has not slowed as expected. At the beginning of 2025, inflation stood at 2.5%, but in the most recent quarter it rose to 3%, reaching the upper limit of the central bank’s target range.
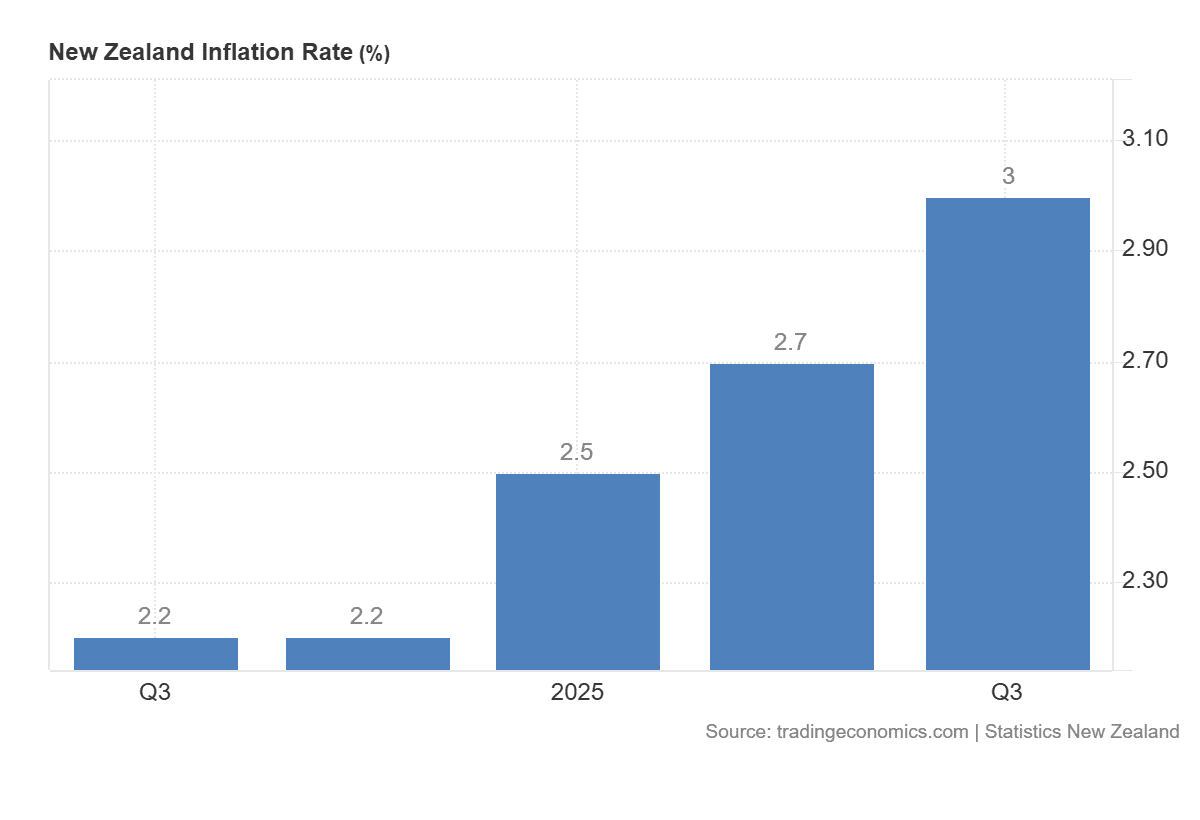
Source: TradingEconomics
Given this backdrop, it will be key to see whether the post-decision statement addresses short-term inflation dynamics. If inflation becomes a persistent concern, the RBNZ may need to abandon its accommodative stance and adopt a more neutral outlook for 2026.
Markets have grown accustomed to a low-rate environment in New Zealand, so any signal of a shift toward a more restrictive policy could reshape investment expectations and restore interest in the New Zealand dollar, potentially triggering renewed buying pressure on NZD/USD in the short term.
Is the Rate Differential Still Relevant?
When analyzing NZD/USD, it is important to consider decisions not only from the RBNZ but also from the Federal Reserve (Fed). Unlike New Zealand, the United States maintains a relatively high interest rate, which continues to draw global demand toward USD-denominated assets, limiting the NZD’s ability to recover consistently.
Currently, the Federal Reserve’s benchmark rate is 4.00%, while a possible cut from the RBNZ would lower its rate to 2.25%, sustaining a 1.75% differential in favor of the U.S.
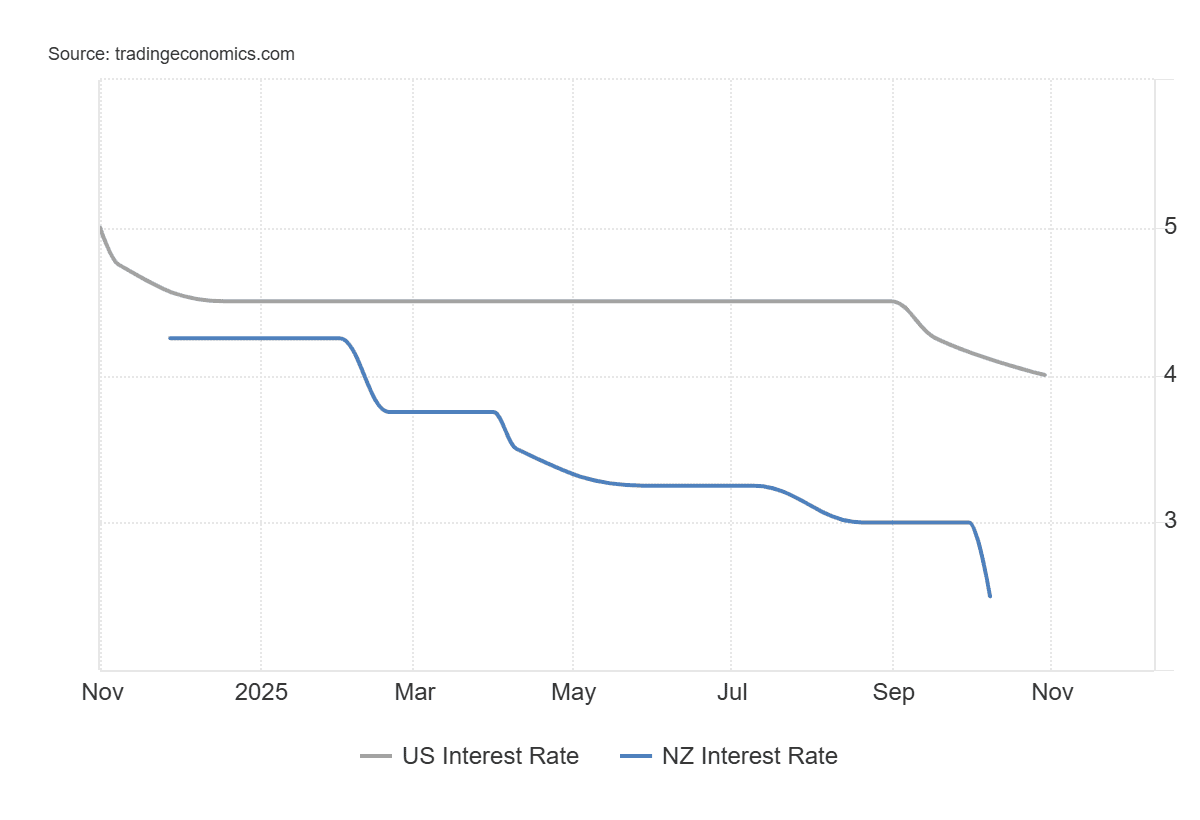
Source: TradingEconomics
However, expectations for the Fed have begun to shift. According to CME Group, there is now an 84.9% probability that the Fed will cut its rate to 3.75% in December, narrowing the differential to 1.5%, which could provide some relief for the New Zealand dollar.
Thus, although the higher U.S. interest rate continues to explain the prolonged bearish trend in NZD/USD, a more dovish tone from the Fed could weaken the U.S. dollar in the short term and activate buying pressure in the pair—especially if the RBNZ does not signal further cuts moving into 2026.
NZD/USD Technical Outlook
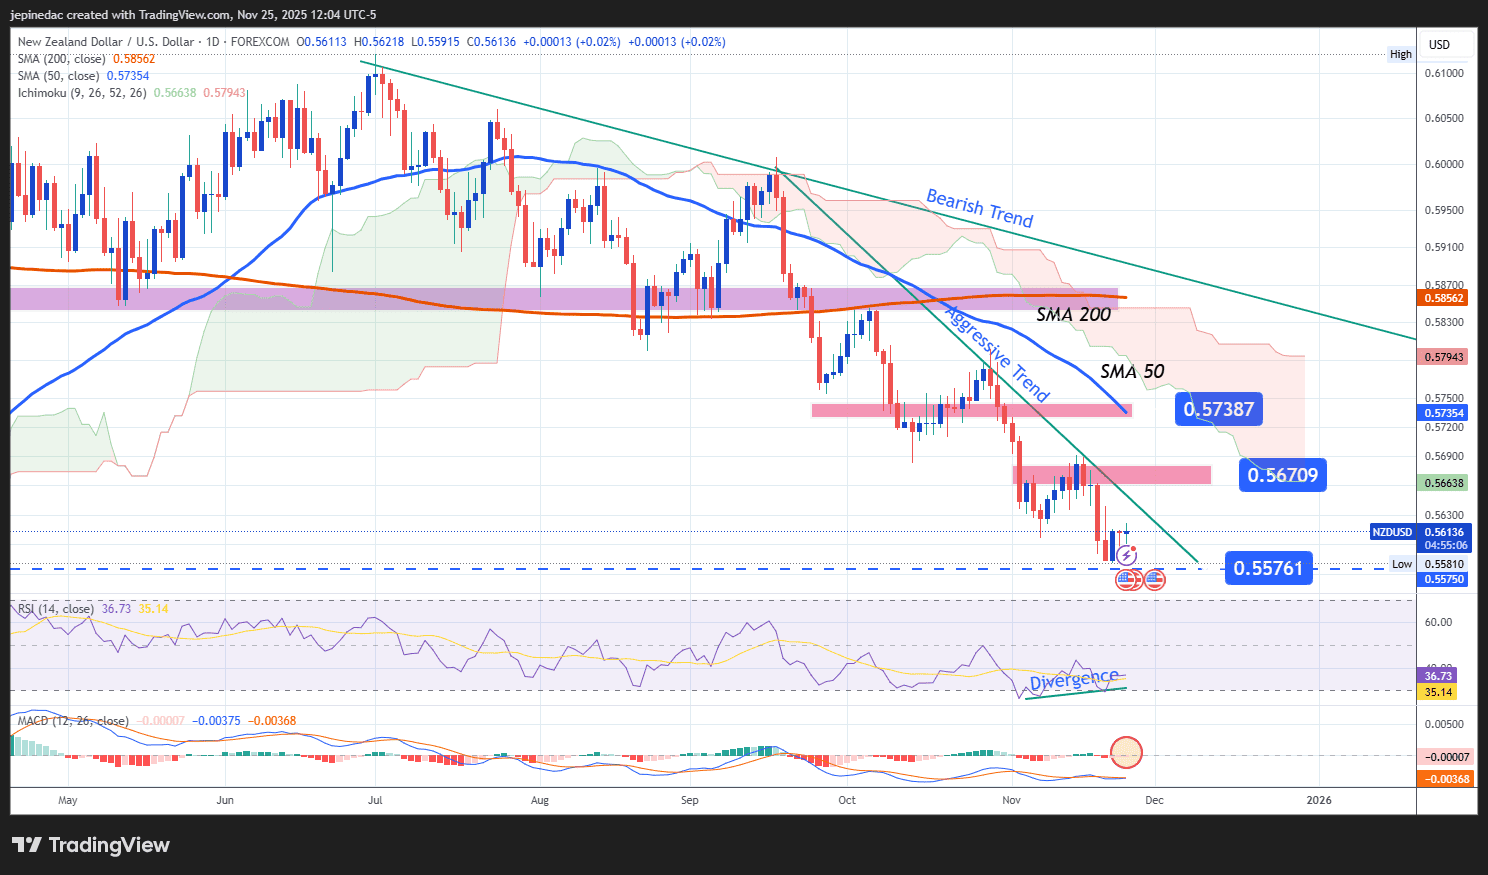
Source: StoneX, Tradingview
- Accelerated Downtrend: Since early July, NZD/USD has maintained a dominant bearish structure, forming a clear downward trendline. Since mid-September, this trendline has steepened, creating a more aggressive pattern, with the pair trading consistently below the 50-period simple moving average.The price is now approaching the year’s lows, and as recent sharp declines begin to show short-term neutrality, some room may open for bullish corrections in the coming sessions.
- RSI: Although the RSI remains below the neutral 50 level, indicating a predominant bearish bias in recent sessions, the indicator is showing higher lows while the price makes lower lows—a bullish divergence that suggests oversold pressure and the possibility of short-term upward corrections.
- MACD: The MACD histogram reflects neutrality, with recent oscillations near the zero level, indicating the absence of a clear directional force. If this continues, a short-term indecision phase may develop.
Key Levels:
- 0.55761 – Major Support: Represents the year’s low zone and serves as the primary bearish barrier. If selling pressure continues below this level, the aggressive downtrend could extend into the coming weeks.
- 0.56709 – Nearby Resistance: A recent retracement level, considered the most important short-term resistance, which may act as a technical barrier to bullish corrections.
- 0.57387 – Major Resistance: This level aligns with the 50-period simple moving average, making it the most relevant bullish barrier. A move toward this zone could challenge the current bearish structure and open the door to a short-term bullish bias.
Written by Julian Pineda, CFA, CMT – Market Analyst
Follow him on: @julianpineda25






