
S&P 500 Key Takeaways
- Friday’s record high was accompanied by an unusually low < 15 reading on the VIX.
- A record S&P 500 close combined with subdued volatility has historically looked more like a stable bullish regime than a sign of complacency immediately preceding a major reversal.
- None of the prior 40 signals experienced a -10% closing drawdown over the following 13 weeks, versus roughly 14% of ordinary periods.
Despite (or arguably, because of) the weaker-than-expected US jobs report, the S&P 500 set a record high Friday.
The S&P 500 has set 27 record highs already this year, so that isn’t remarkable in itself, but the record high was accompanied by an unusually low reading on the Volatility Index, or VIX, which closed last week below 15. This combination of record highs and low expected volatility is relatively rare.
Filtering out some of the overlapping signals by only counting the first such instance in at least four weeks, there have been only 40 times that the S&P 500 has set a record high with the VIX below 15 since since the VIX was created in 1990.
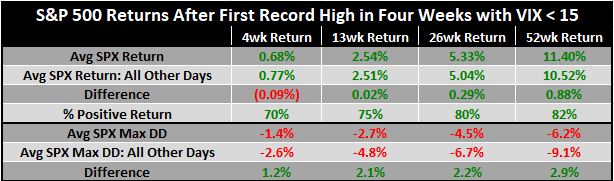
Looking at these past instances is revealing. As the table below shows, the average near-term S&P 500 returns are slightly lower than all other periods, while the longer-term returns are generally more positive. More significantly, the average drawdown is meaningfully lower across all the timeframes studied:
Source: StoneX. Past performance is not necessarily indicative of future returns.
In other words, an all-time high combined with subdued volatility has historically looked more like a stable bullish regime than a sign of complacency immediately preceding a major reversal. None of the prior 40 signals experienced a -10% closing drawdown over the following 13 weeks, versus roughly 14% of ordinary periods.
By itself, this is just one study of market behavior, but it adds to other bullish signals to suggest that the current bull market could have further to run, especially over the medium-term, and that a low VIX should not automatically viewed as excessive complacency.
S&P 500 Technical Analysis: SPX Daily Chart
Source: Tradingview, StoneX
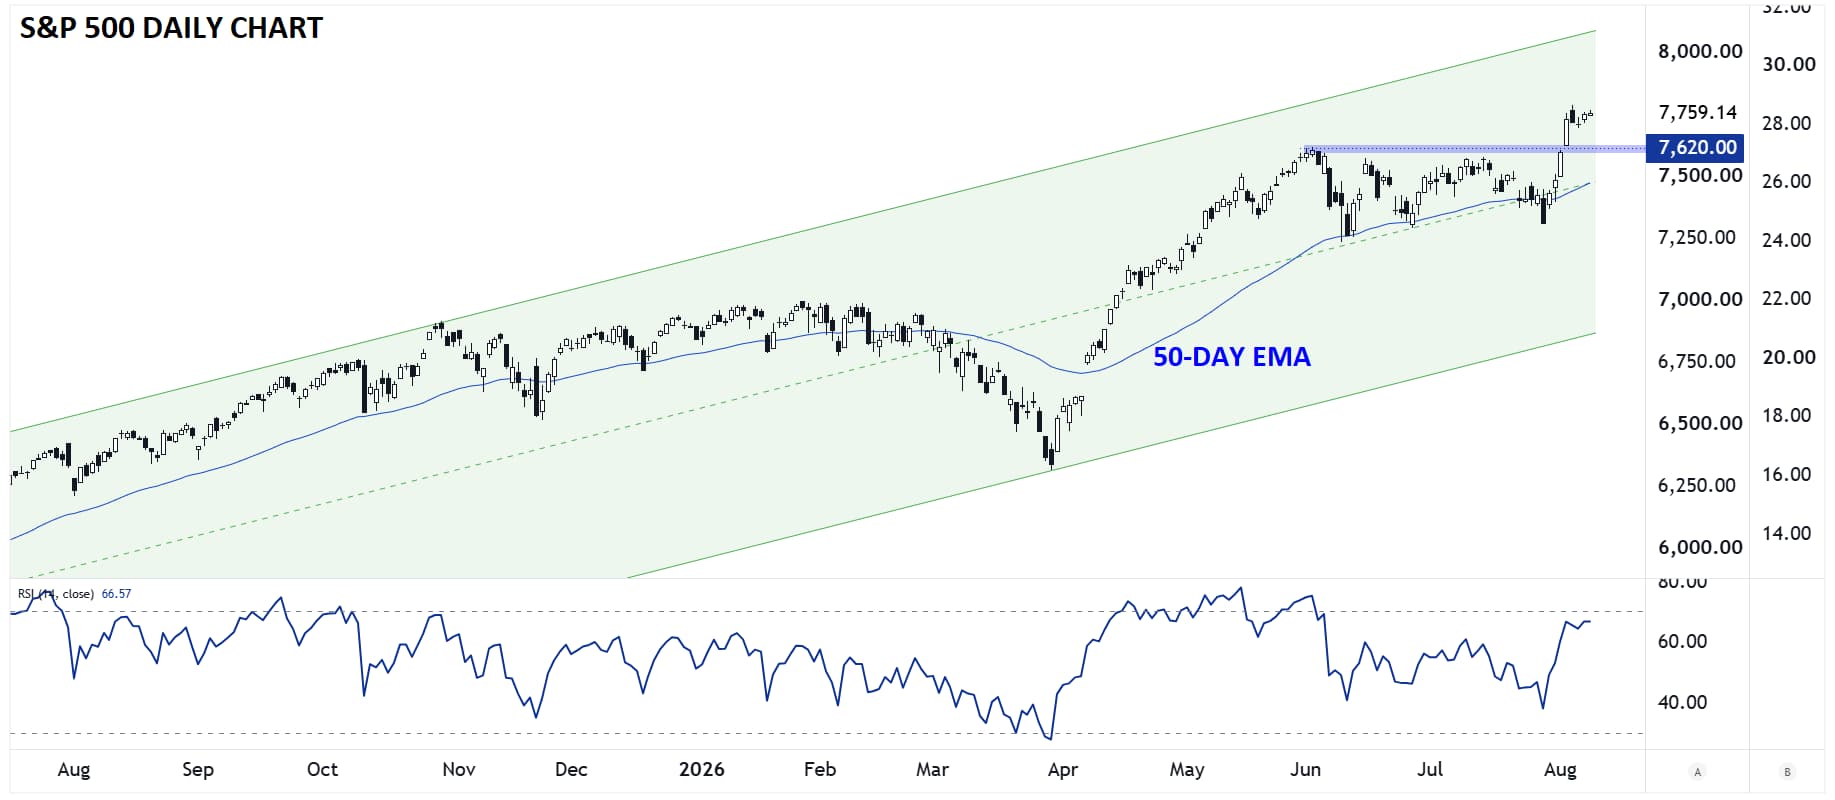
Looking at the chart of the S&P 500, the index is trading comfortably within its 17-month bullish channel, with room to run further toward 8,000 before encountering meaningful resistance. Having just broken out of a 3-month consolidation range, the odds favor continued gains as long as the index remains above the previous all-time high at 7620 and the rising 50-day EMA near 7500.
A break below those support levels would raise fears of a failed breakout and could open the door for a move toward the bottom of the rising channel near 7,000.
-- Written by Matt Weller, Global Head of Research
Check out Matt’s Daily Market Update videos on YouTube and be sure to follow Matt on Twitter: @MWellerFX