The trading week has not been particularly favorable for risk appetite in the short term, and this is now becoming increasingly evident in the performance of the S&P 500. During today's session, the index is down nearly 4.2%, marking its largest intraday decline of 2026.
The selling pressure has been driven mainly by a deterioration in confidence surrounding the outlook for the artificial intelligence industry in the United States, combined with caution ahead of the upcoming Non-Farm Payrolls (NFP) report. Together, these factors have generated a significant increase in uncertainty across equity markets and could continue weighing on the SPX in the coming sessions.

Is Risk Appetite Beginning to Fade?
One of the main catalysts behind today's selloff has been growing concern surrounding the artificial intelligence industry. For several weeks, investors had already been questioning the elevated levels of capital spending seen across some of the world's largest technology companies and whether those investments will eventually translate into stronger revenue growth and profitability.
However, this week the situation took on a different dimension following the U.S. midterm elections. The Democratic Party's victory across key legislative fronts has revived concerns about a more restrictive regulatory environment for the artificial intelligence industry and the infrastructure development associated with the sector.
Over the past several months, members of the party have repeatedly highlighted the need for stricter oversight of the industry. Some estimates even suggest that nearly 30% of the additional data center capacity expected by 2028 could be affected if new regulations begin to materialize.
This development is particularly important because a significant portion of current valuations across major technology companies is closely tied to AI-related growth expectations. As a result, any event that increases uncertainty around the sector tends to have an immediate impact on investor confidence.
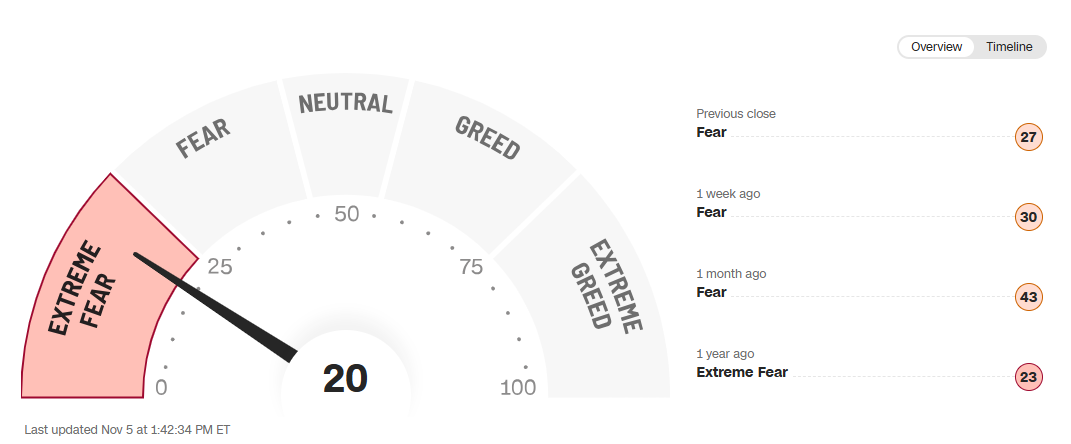
This loss of confidence is already visible in the Fear & Greed Index, which measures risk sentiment across financial markets. The indicator has returned to extreme fear territory, trading near 20 points, a signal that reflects the rapid deterioration in sentiment observed over recent sessions and suggests that conditions needed to sustain consistent demand for risk assets have weakened considerably.
Source: CNN
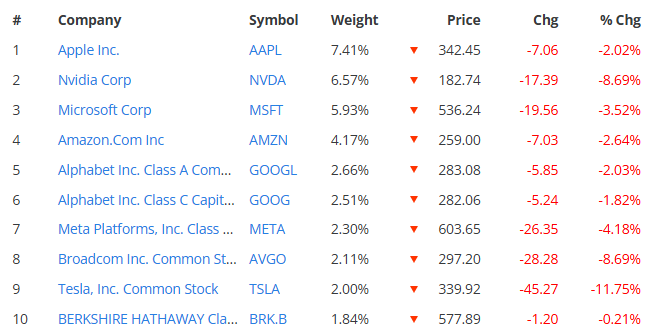
The impact is also becoming increasingly visible among companies most closely linked to the artificial intelligence ecosystem. During today's session, Nvidia is down nearly 8.0%, AMD has fallen around 15.0%, Micron is also down close to 15.0%, and Intel has lost approximately 7.7%. All of these companies play a direct role in AI infrastructure development and remain highly sensitive to changes in the sector's outlook.
However, the weakness is no longer limited to AI-related names. Concerns around excessive capital expenditure are now being combined with potential regulatory risks, creating a broader wave of caution across equity markets. Looking at the largest components of the S&P 500, all of the top ten companies are trading in negative territory during the session. Even Tesla is down nearly 11.75%, reflecting not only valuation concerns but also additional political risks associated with the new legislative balance of power.
Source: Slickcharts
With all of this in mind, investors continue to question the sustainability of the expectations surrounding the artificial intelligence industry. As long as concerns over tighter regulation persist and elevated investment spending continues without translating into more meaningful improvements in profitability, the deterioration in confidence could remain an important factor influencing the SPX over the coming weeks.
Could NFP Become Another Headwind?
It is also important to keep in mind that markets are preparing for tomorrow's Non-Farm Payrolls (NFP) release. Current consensus estimates point to approximately 65,000 new jobs, compared with the previous reading of 29,000.
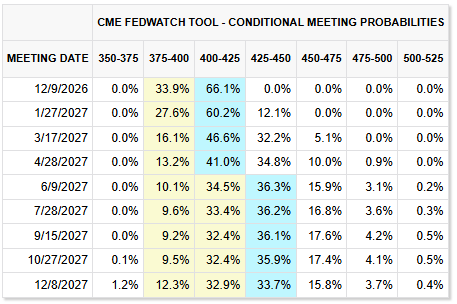
The importance of this report lies in the fact that employment remains one of the most important pillars influencing Federal Reserve policy decisions. For now, markets continue to assign a probability of more than 60% to another rate hike before the end of 2026, reflecting that expectations for a more restrictive monetary policy stance remain in place.
Source: CMEGROUP
Under this scenario, a significantly stronger-than-expected employment reading could reinforce the perception that the U.S. economy remains resilient enough to withstand higher interest rates. This would provide the Federal Reserve with additional room to focus on inflation risks and potentially maintain a relatively aggressive stance over the coming months.
This point is particularly important for equity markets because a higher-rate environment tends to increase financing costs, reduce available liquidity, and weigh on consumption and investment activity. Under these conditions, a more aggressive Federal Reserve could become an additional source of pressure for the market, amplifying the loss of confidence observed during today's session and maintaining a backdrop of weakness that could remain relevant for the SPX over the medium term.
S&P 500 Technical Outlook
Source: StoneX, Tradingview
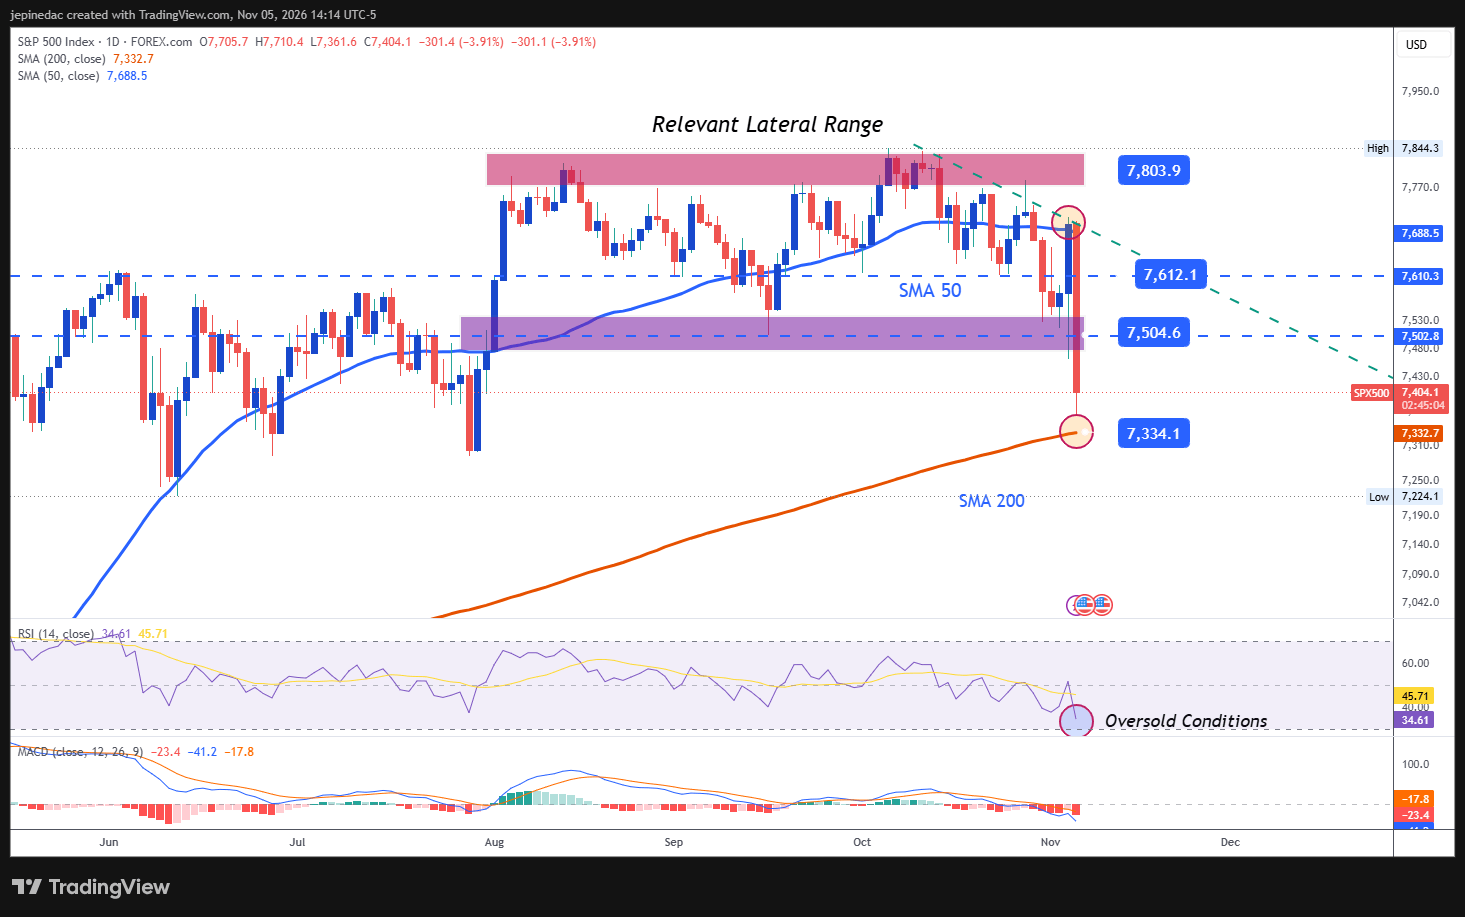
- Bearish momentum begins to dominate: Until only a few sessions ago, the S&P 500 was managing to hold within the broad trading range that had dominated price action for several months. However, today's sharp decline has begun to break through that structure and has returned control to sellers. If price continues to push through important support levels, a more consistent bearish trend could begin to develop on the daily chart.
- MACD: The MACD histogram continues to extend further below the 0 neutral line, reflecting increasingly bearish momentum within short-term moving averages. As long as this behavior remains in place, the bearish bias could continue gaining relevance.
- RSI: A similar picture can be observed in RSI, which continues to trade below the 50 neutral level, highlighting the dominance of selling pressure during recent sessions. However, the magnitude of the decline is also pushing the indicator closer to the 30 oversold threshold, a situation that may begin to signal excessive downside momentum and potentially open the door to short-term corrective rebounds.
Key Levels:
- 7,600 points – Key Resistance: A level that coincides with important retracement areas observed in recent weeks and currently represents the main upside barrier on the chart. A return toward this level could reduce the credibility of the recent selloff and restore a more stable range-bound environment.
- 7,500 points – Near-Term Barrier: An important psychological area that has previously acted as a significant technical reference. This could become the primary level to monitor in the event of short-term bullish corrections.
- 7,300 points – Key Support: A level that coincides with important lows observed over recent months and aligns with the 200-period simple moving average. Price action consolidating below this area could reinforce seller dominance and open the door to a more consistent bearish trend in the weeks ahead.
Written by Julian Pineda, CFA, CMT – Market Analyst
Follow him on: @julianpineda25