
The repercussions of the U.S.–Iran war have contributed to a notable shift in market sentiment, as reflected in the results of the Israeli and U.S. midterm elections. Voters have pushed back against war-related inflationary pressures, which have weighed on markets throughout the year.
The new Congress is due to take office in January 2027, but markets are forward-looking and are already pricing in what a potential check on Trump’s agenda could mean for markets.
Recent price action shows:
- Silver rebounded from support near 49, alongside daily oversold conditions last seen in 2022.
- Gold bounced from support near 3,870, alongside daily oversold conditions last seen in 2023.
- Crude oil pulled back from its 2026 highs and daily overbought conditions, signaling possible hopes for U.S.–Iran negotiations as well as a response to election sentiment.
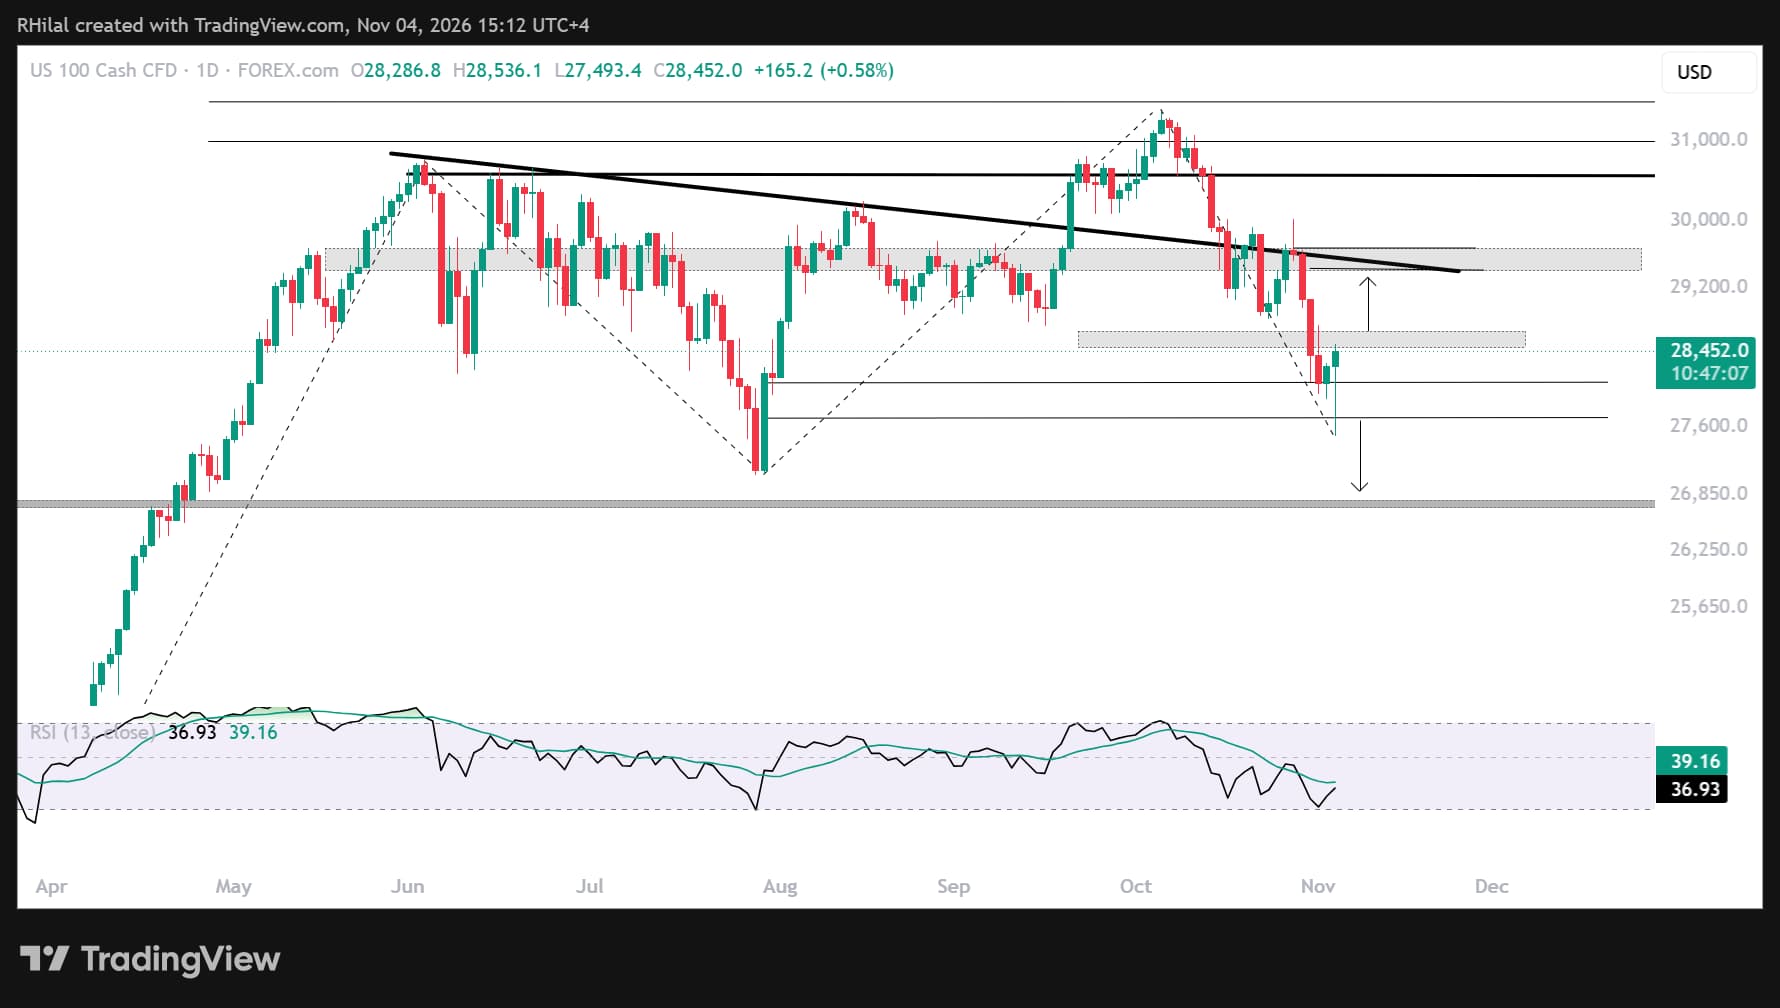
- The Nasdaq rebounded from the 27,500 support and daily oversold conditions last seen in March 2026.
- The U.S. Dollar Index fell below its 10-month rising support.
These moves hint at a shift toward risk-on sentiment after a series of risk-off indicators reached contrarian extremes. They also followed a period in which charts were testing key support levels ahead of U.S. midterm election week.
I discussed these setups in my weekly outlook on StoneX TV:
This content was created by an affiliate of FOREX.com and represents the views and opinions of the author or speakers, not those of FOREX.com, StoneX Group Inc. or its subsidiaries. The content has not been independently reviewed by FOREX.com.
Despite the latest rebounds, it may still be premature to conclude that the geopolitical outlook has definitively shifted. While consumer sentiment has turned against the war, Trump’s agenda has two months left, and U.S.–Iran tensions, uncertainty over the nuclear program and nuclear threats remain. The key setups therefore remain in focus.
Nasdaq Price Outlook: Daily Time Frame – Log Scale
Source: TradingView
The Nasdaq has been tracing a sideways consolidation and a possible broader corrective pattern from its June 2026 high. The chart is now testing key support levels that could help define the longer-term outlook for bullish continuation.
The latest rebound aligned with the 100% extension of the June–July–October cycle and oversold conditions last seen in August and March. The extended lower wick may indicate that selling pressure failed to sustain the move lower, establishing a potential support base.
A close below 27,600 could put another 1,000 points of downside into focus, targeting the 26,700–26,600 zone as a possible longer-term dip-buying area.
On the upside, a close back above 28,800 would bring the multi-month downtrend resistance near 29,400 and 29,700 into focus. A break above these levels would provide key confirmation for a continuation of the rally toward record highs. This scenario would likely align with risk-on sentiment and could develop alongside further gains in silver, given the metal’s use in the technology industry.
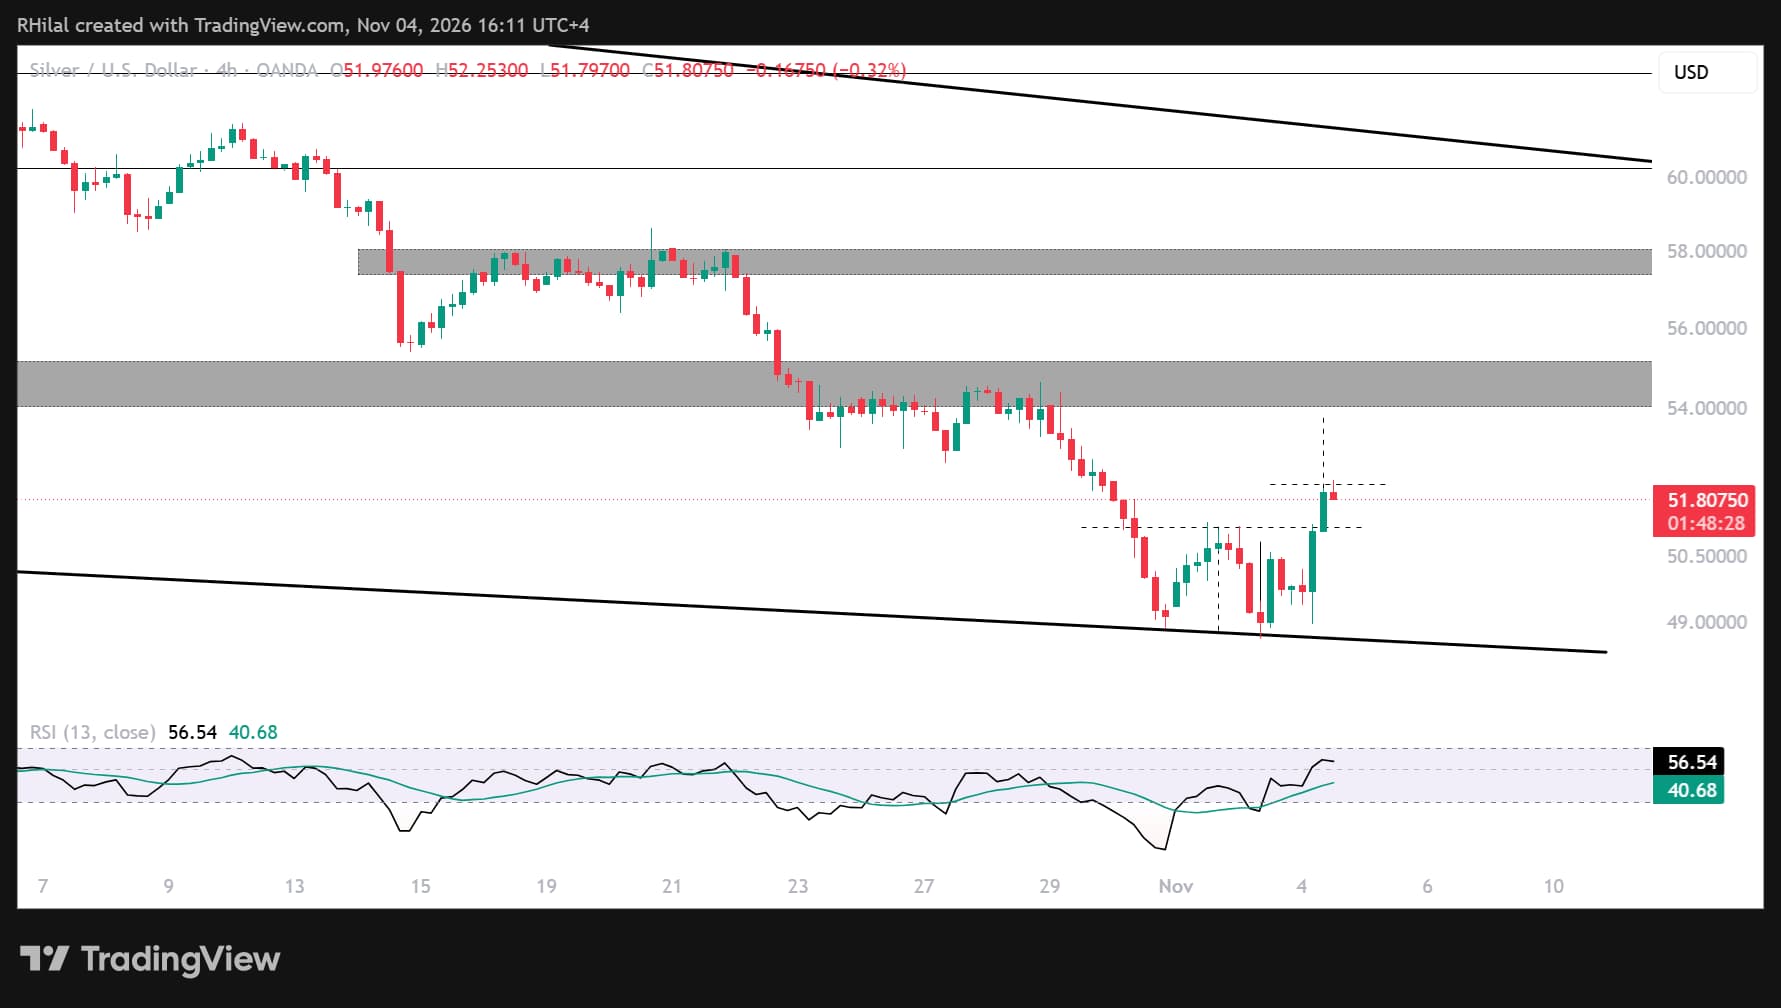
Silver Price Outlook: Daily Time Frame – Log Scale
Source: TradingView
On the daily chart, silver is rebounding from oversold conditions last seen in 2022 and from multi-month descending support connecting lower lows since February 2026, near 49. The chart briefly extended a wick to 48.60 before reversing. Such price action can occur near market bottoms, where price tests areas with clustered orders before turning higher.
As long as price holds above this support zone, the short-term bias remains bullish. A close above 52.20, 54 and 55—and a break above the descending resistance that has guided price action since January 2026—could confirm a longer-term bullish outlook.
On the downside, a close below 49 would expose 45 as the next major support and potential dip-buying zone. This level aligns with a historical confluence zone comprising:
- Multi-decade resistance levels from 1980, 2011 and 2025
- The 61.8% retracement of the 1930–2026 advance
- The October 2025 low and support
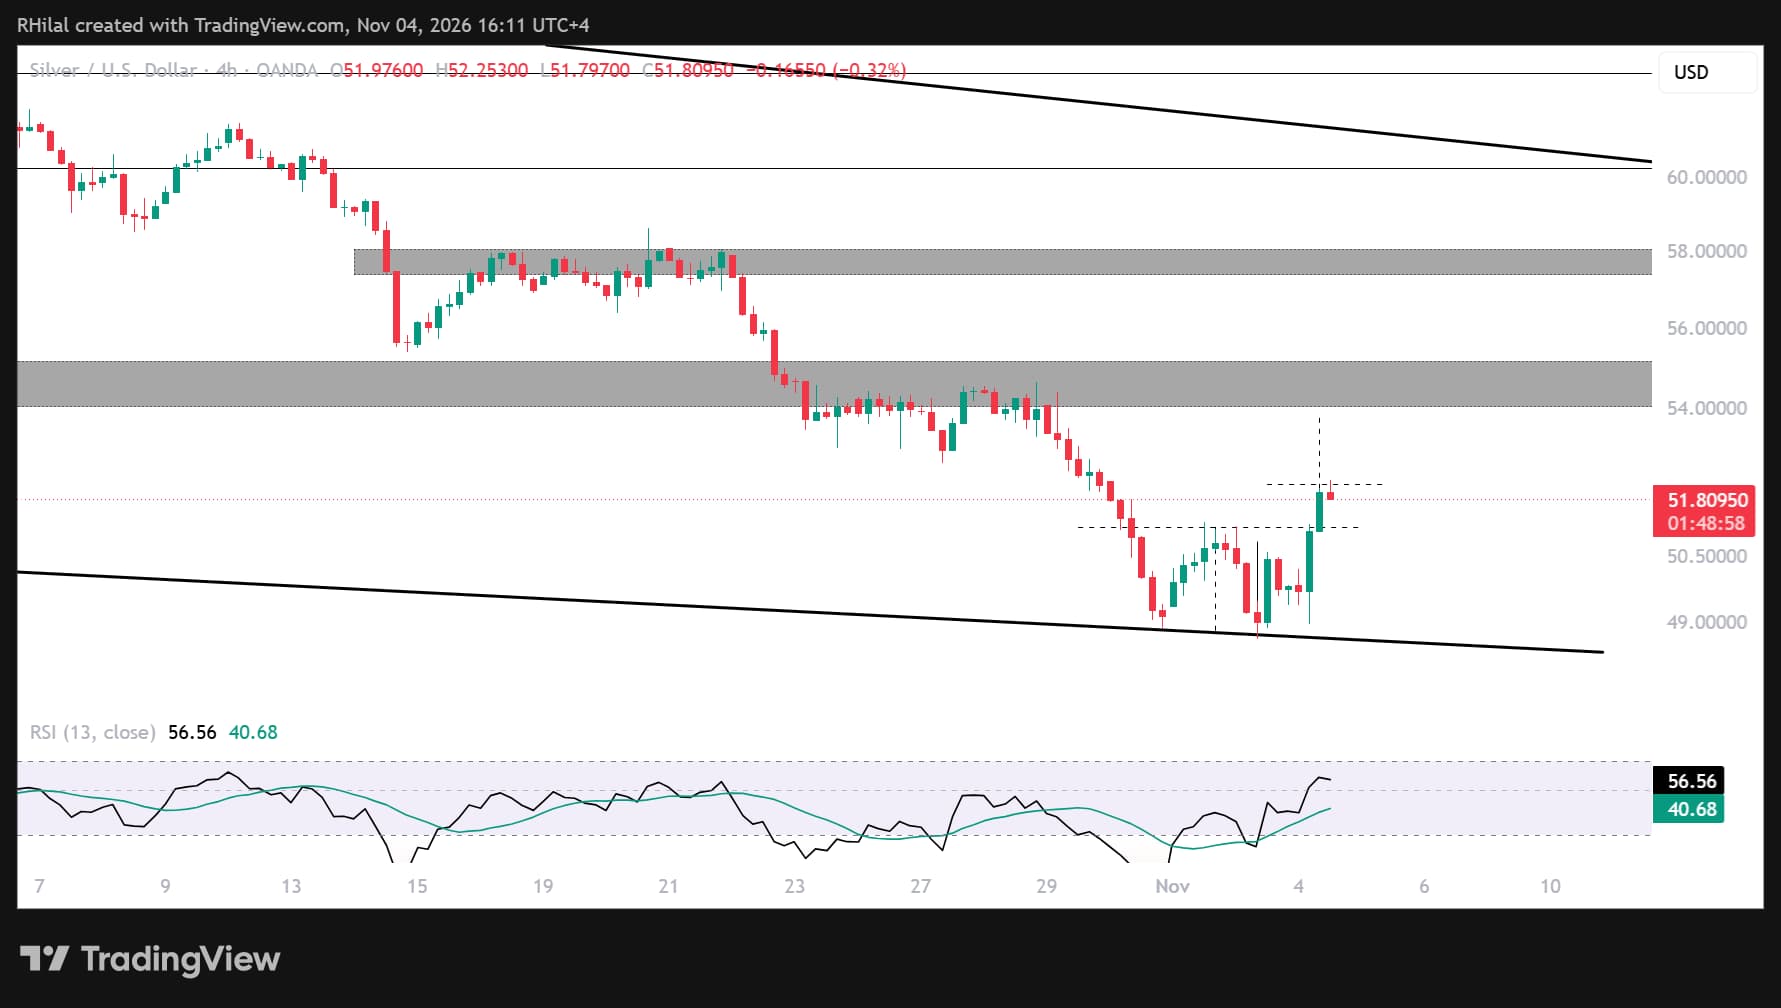
Silver Price Outlook: 4-Hour Time Frame – Log Scale
Source: TradingView
On the four-hour chart, a bullish divergence is emerging between the RSI and price action. A possible double-bottom formation could target 54 following a close above 52. A pullback to the pattern’s neckline could provide support for the rally; a break below it could shift focus back toward the low near 49.
Setups like these emerge from time to time, when short- and long-term charts align. However, the possibility of another leg lower remains, as does the risk of another rate hike in December and further changes in the geopolitical conflict. These factors keep open the possibility of another long-term dip-buying opportunity in silver.
Written by Razan Hilal, CMT
Follow on X: @Rh_waves