Silver Talking Points:
- The slide in silver has continued and the metal is currently down by more than 50% from the January high.
- It took 14 years for Silver to take out the $50 level after coming less than 20 cents away from that price back in 2011.
The pent up breakout hit with a fury last year as breakout at $50 led to a move that more than doubled over the next few months. Silver had a full head of steam into the 2026 open and in short order the metal was already testing above the $120/oz level. But what started as a pullback soon turned into a reversal, helped along by the fear of inflation from higher oil prices in March.
Since then it’s been about as non-ideal of a backdrop as possible for the long side of metals, as higher inflation has driven more-hawkish policy, while US Treasury yields have jumped to fresh decade or multi-decade highs along the curve. And while the pullback has been sizable in metals, what is perhaps more notable is how well support has come into play. With gold, it was the fight at the $4k handle. In Silver, it’s been the $60 level so far and perhaps most notable is the fact that the $50 level hasn’t even come into play as support with buyers stepping in ahead of a test there.
Silver Weekly Chart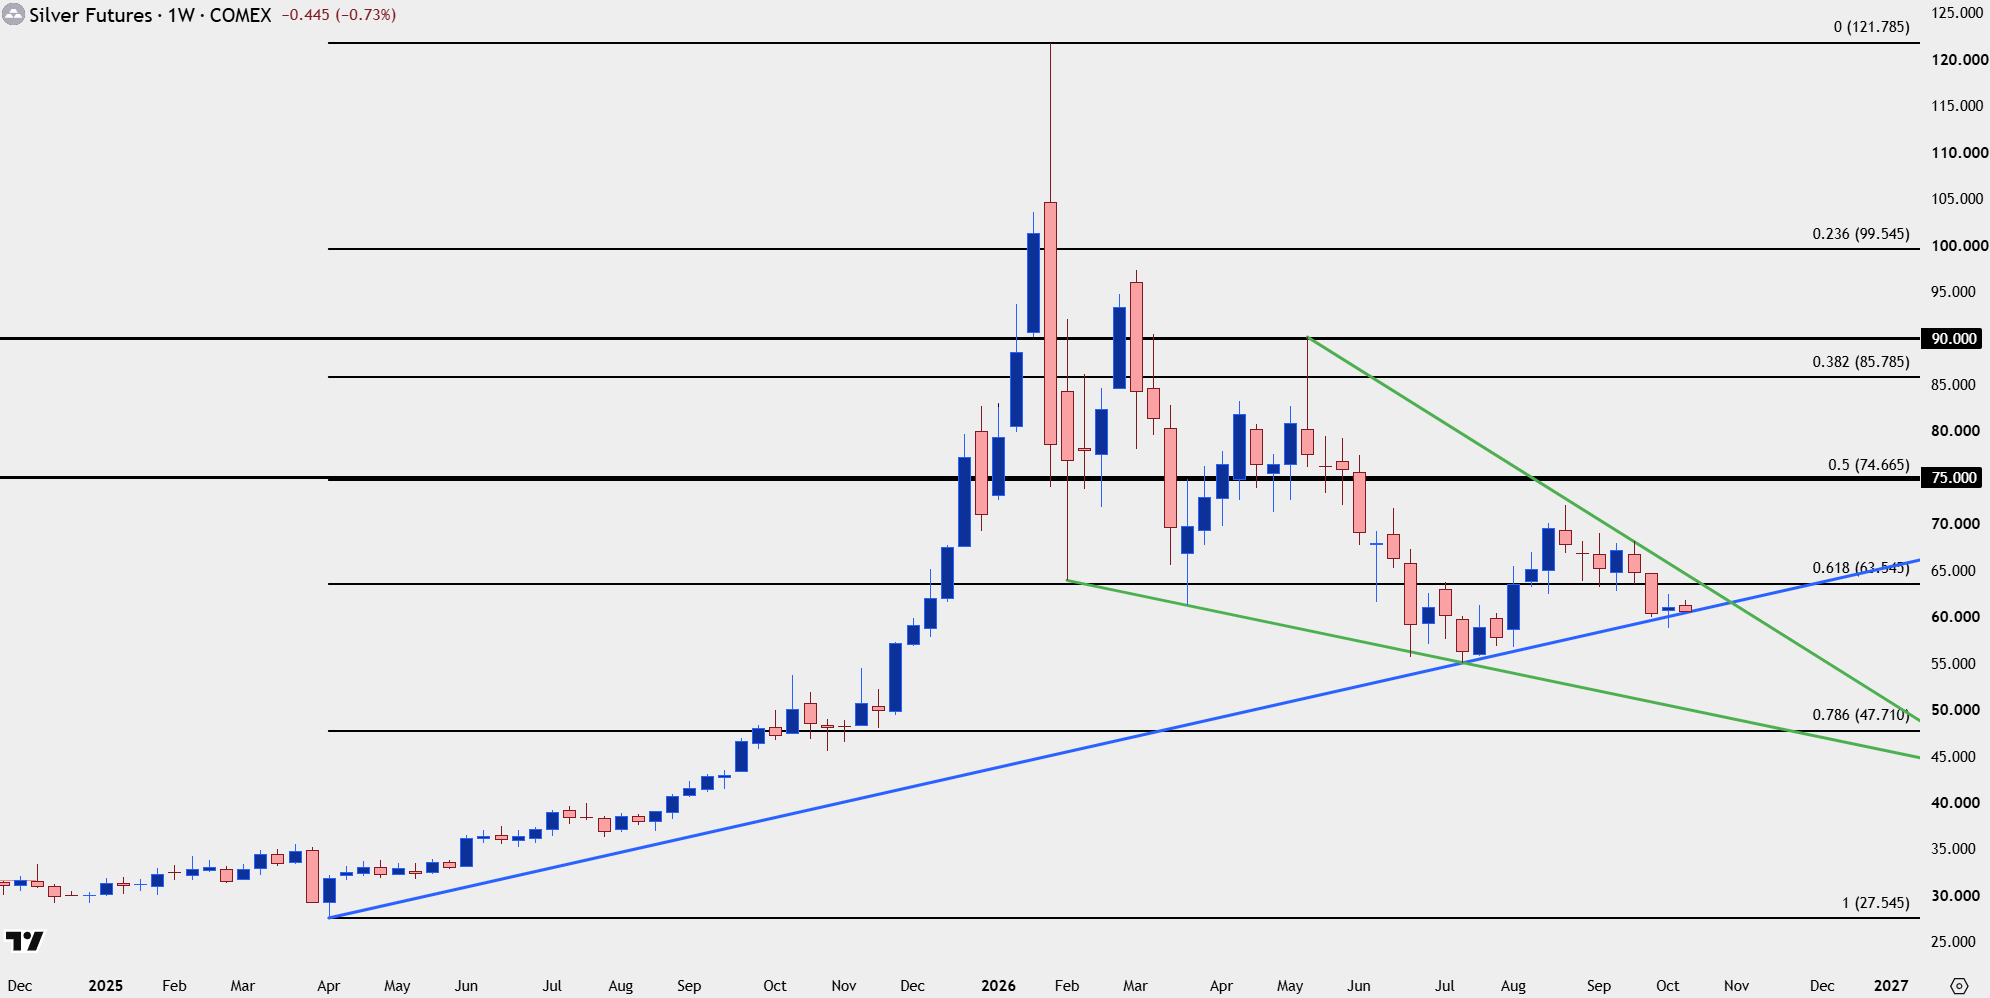
Chart prepared by James Stanley; data derived from Tradingview
Silver Structure
Last week saw a single daily close below the $60 level in Silver, and so far that’s produced a bounce, but from the daily chart below, structure is still bearish as that poke below the big figure was a lower-low and that goes with a prior lower-high. This does a couple of things as it helps to provide existing structure but it also shows what bulls need to beat if they want to re-take control, and the prior swing of support-turned-resistance at 62.45 stands out as the level that buyers need to push through to produce a higher-high.
And for higher-low support, the $60 level stands out as a potentially big spot, with 59.23 below that and then the current low of 58.73 marking invalidation for bullish scenarios.
Silver Daily Chart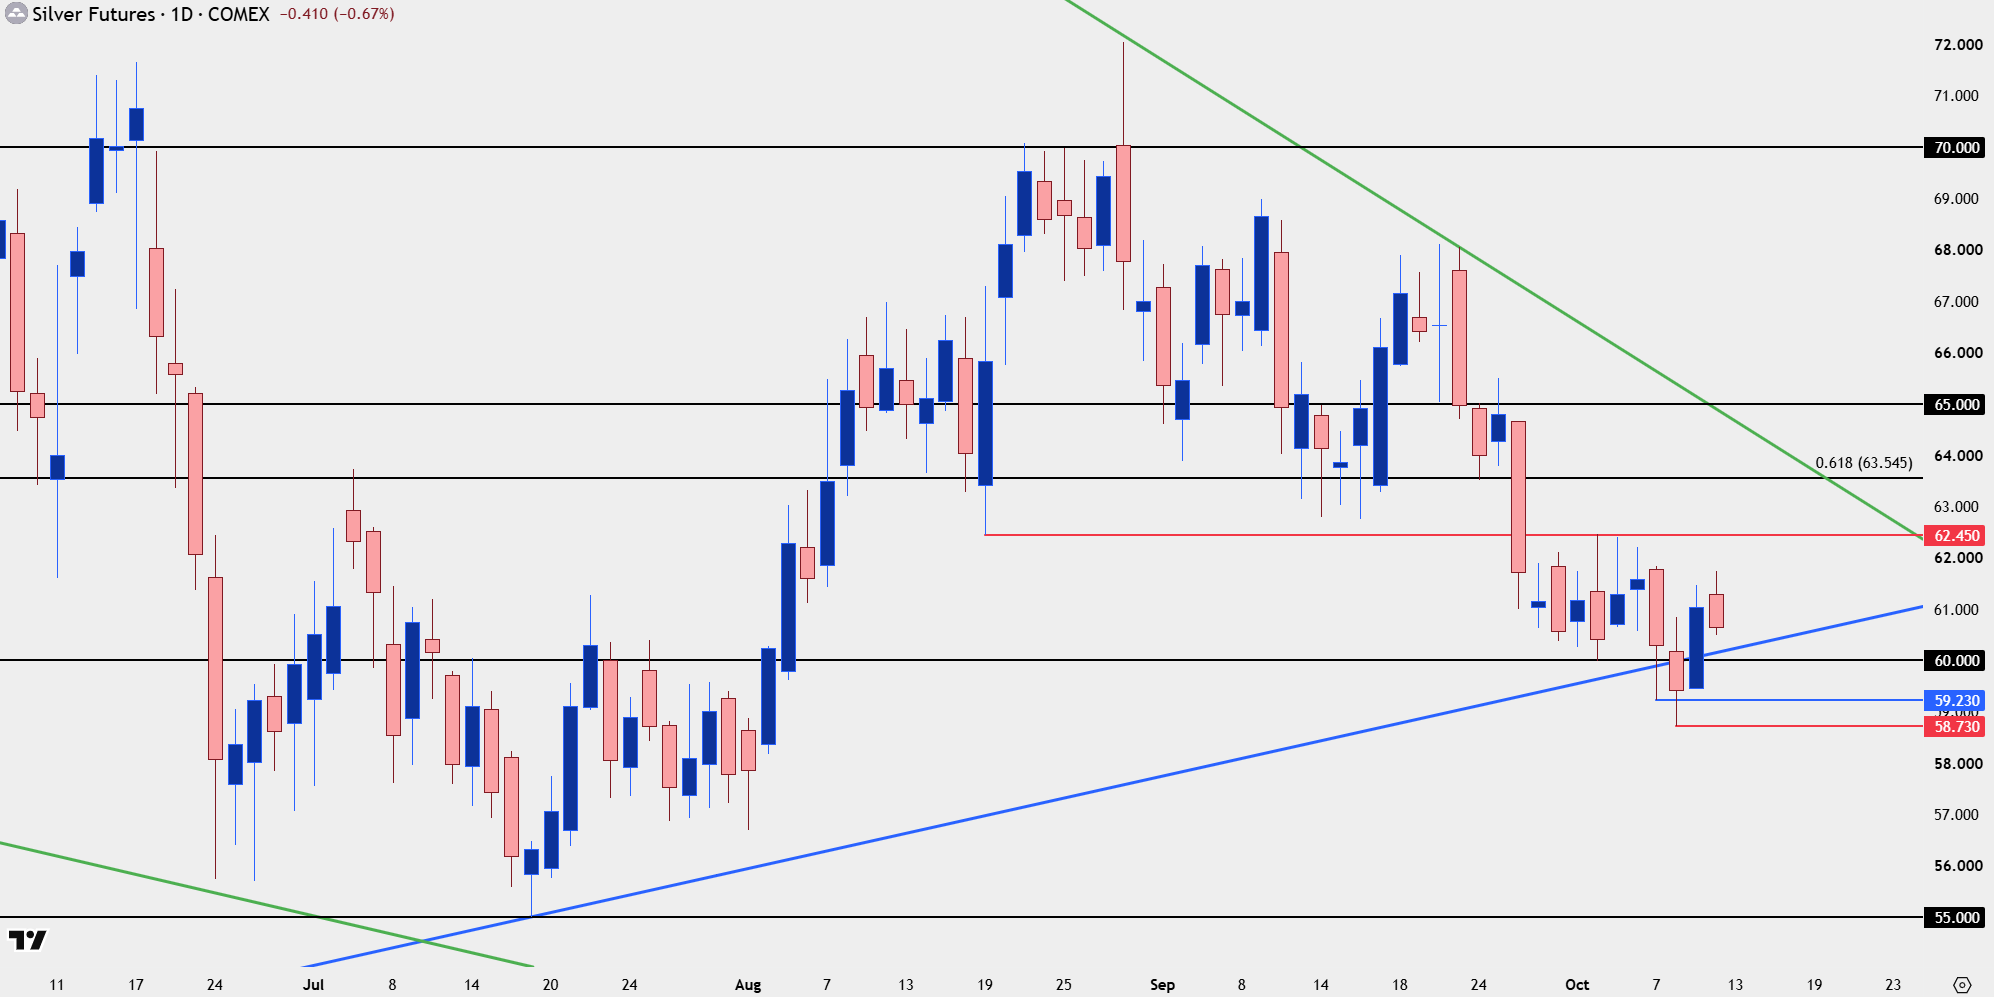
Chart prepared by James Stanley; data derived from Tradingview
--- written by James Stanley, Senior Market Analyst, Global Macro