


Weekly Technical Trade Levels on USD Majors, Commodities & Stocks
- Post-Fed technical setups we are tracking into the weekly open as Middle East War Expands
- Next Weekly Strategy Webinar: Monday, June 30 at 8:30am EST
- Review the latest Video Updates or Stream Live to my YouTube playlist.
In this webinar we take an in-depth look at the technical trade levels for the US Dollar (DXY), Euro (EUR/USD), British Pound (GBP/USD), Australian Dollar (AUD/USD), Canadian Dollar (USD/CAD), Japanese Yen (USD/JPY), Swiss Franc (USD/CHF), Gold (XAU/USD), Crude Oil (WTI), and Bitcoin (BTC/USD). These are the levels that matter on the technical charts into the weekly open as markets weigh the impact of US strikes on Iran.
US Dollar Price Chart – USD Weekly (DXY)
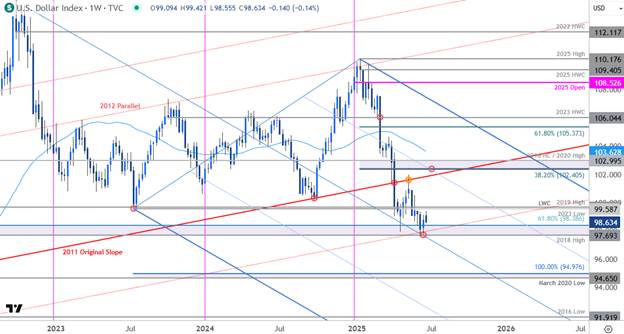
Chart Prepared by Michael Boutros, Sr. Technical Strategist; DXY on TradingView
The U.S. Dollar Index has responded to a critical support zone we’ve been tracking for months now at 97.69-98.38- a region defined by the 2018 swing high, the April lows, and the 61.8% of the 2018 advance. Resistance is eyed with the 2023 low / 2019 high at 99.58- the focus is on a breakout of this range for guidance with the bears still vulnerable while above the median-line. U.S. Personal Consumption Expenditures on tap Friday- watch the weekly close here. Review my latest US Dollar Short-term Outlook for a closer look at the near-term DXY technical trade levels.
Canadian Dollar Price Chart – USD/CAD 240min
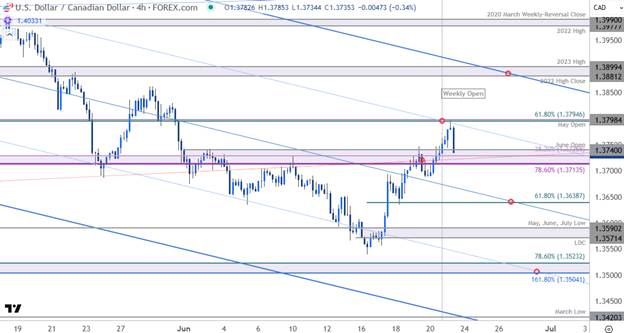
Chart Prepared by Michael Boutros, Sr. Technical Strategist; USD/CAD on TradingView
The USD/CAD recovery exhausted into confluent resistance this morning at 1.3798/95- a region defined by the 61.8% Fibonacci retracement of the December 2023 advance and the objective May open. The pullback is testing pivotal support at former resistance early in the session at 1.3713/40- looking for a reaction of this mark. Losses would need to be limited to 1.3638 IF price is heading higher on this stretch with a topside breach exposing key resistance at the 2022 high close / 2023 high at 1.3881/99. Review my latest Canadian Dollar Forecast for a longer-term look at the USD/CAD technical trade levels.
Australian Dollar Price Chart – AUD/USD Daily
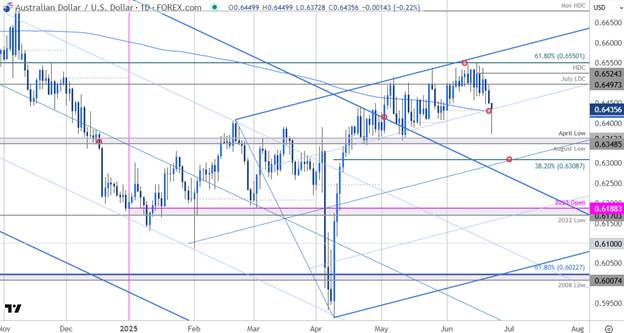
Chart Prepared by Michael Boutros, Sr. Technical Strategist; AUD/USD on TradingView
Aussie is threatening a breakout of the June opening-range today with AUD/USD plunging below confluent support at the monthly open / 200-day moving average around 6428/32. We may have celebrated too early as price has rebounded back into this zone in early US trade- the focus is on today’s close with respect to this threshold.
Initial resistance is eyed with the July low-day close (LDC) at 6497 and is backed by the yearly high-day close (HDC) at 6524. Ultimately a breach above the 61.8% retracement of the September decline at 6550 would be needed to mark uptrend resumption. Confirmation of the break would expose initial support at the August / April lows at 6348/62 and the 38.2% retracement of het yearly range- both levels of interest for possible downside exhaustion / price inflection IF reached. Review my latest Australian Dollar Forecast for a closer look at the longer-term AUD/USD trade technical trade levels.

Economic Calendar – Key USD Data Releases
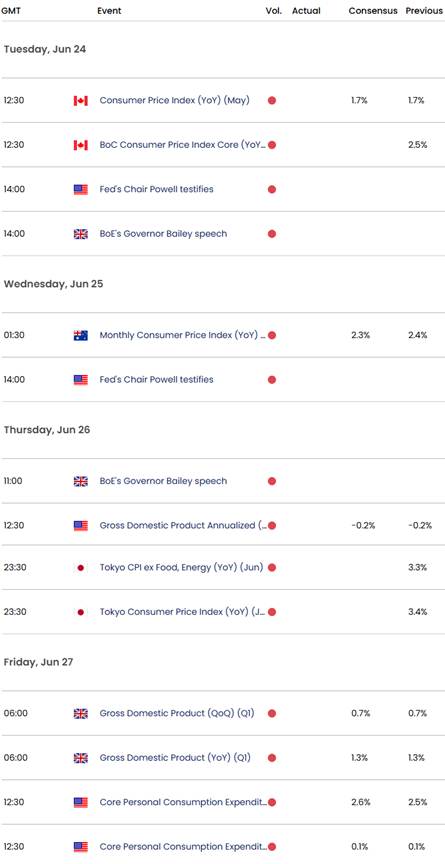
Economic Calendar - latest economic developments and upcoming event risk.
--- Written by Michael Boutros, Sr Technical Strategist
Follow Michael on X @MBForex






