Gold holds 200 dma ahead of NFP
All eyes are on the non-farm payroll report for further clues over when the Fed could make its move to rein in monetary policy.
Expectations are for job growth to slow in August to 750k, down from 943k in July. A softer reading could push back Fed taper concerns which would be supportive for gold.
After unimpressive data this week the weaker USD, which trades around monthly lows is underpinning gold however, the upbeat mood and stocks at all time highs is taking away some shine.
Where next for gold prices?
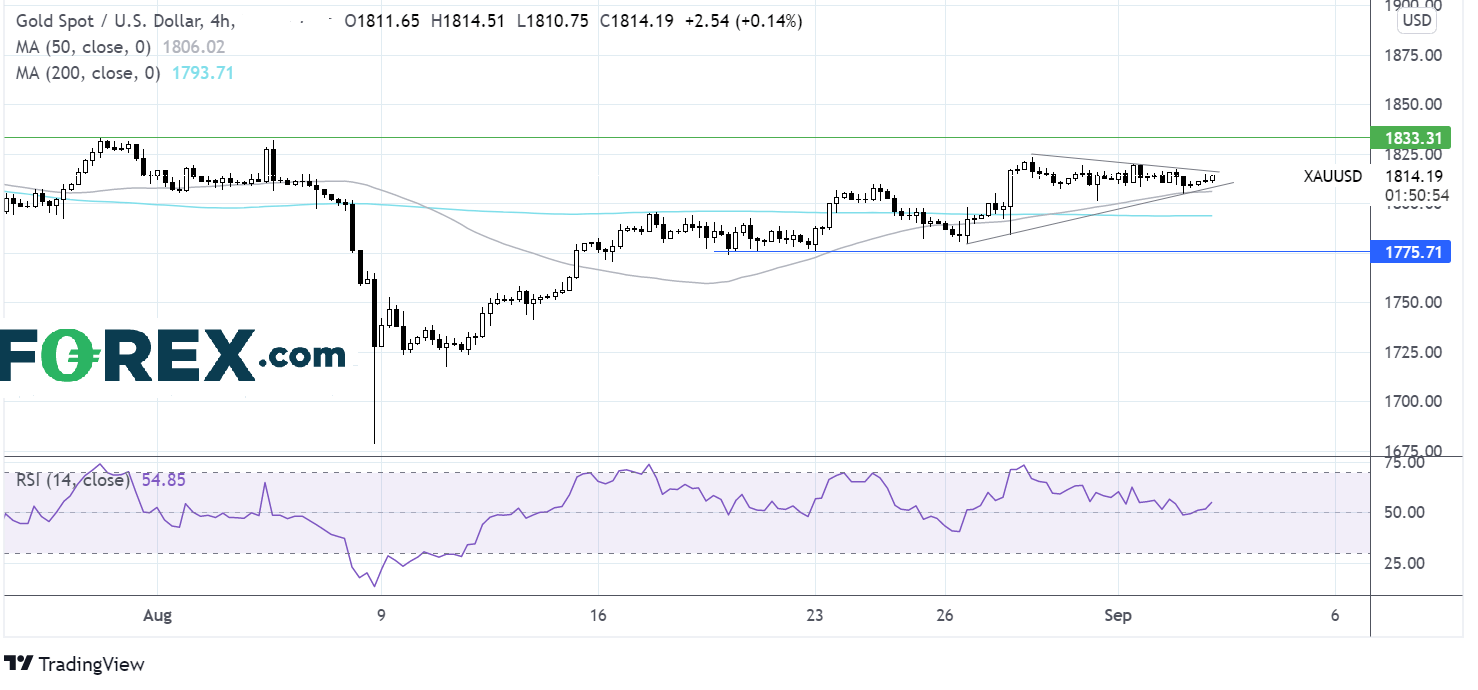
Gold has formed a symmetrical triangle on the 4 hour chart. The 50 sma has crossed over the 200 sma in a bullish move and the RSI is starting to point higher whilst also sitting in mildly bullish territory above 50 alluding towards further upside.
A close above the descending trendline resistance at 1816 could see gold propelled higher towards 1823 the weekly high ahead of 1830 the August high.
On the downside support can be seen at 1806 the ascending trendline support and the 50 sma on the 4 hour chart. A break below here could see the 200 sma tested at 1790, opening the door to 1775.
EUR/GBP struggles around 0.86 ahead of EZ UK services PMI & EZ retail sales
The Euro is being supported by rising inflation both CPI & PPI which is provoking more hawkish calls from the ECB nest.
Yesterday EZ PPI came in at 2.3% MoM well ahead of the 1.1% forecast.
Today Eurozone services PMI will be in focus with expectations of a tick lower to 59.7 from 59.8 in July. This would still be an impressive figure. Eurozone retail sales data is expected to be less upbeat rising just 0.1% MoM in July, after jumping 1.5% in June.
The UK services PMI is also due and expected to confirm the flash reading of 55.5, down from 59.2.
Where next for EUR/GBP?
After breaking out of the descending channel towards the end of August, EUR/GBP extended gains to current levels of 0.86. The pair has been hovering around this level for 2 sessions.
The price is just about clinging to the 100 sma at 0.8585 and the RSI is also above the midline and pointing higher keeping the bulls optimistic of further gains. Any move higher must break above 0.86 in order to push higher to 0.8617 the July 9 high and then 0.8670 the July high.
Failure of the 100 sma to hold could see the pair slip to 0.8550 the 50 sma. A move below this level could negate the near term uptrend. A move below 0.8535 could see the pair re-enter the descending channel.