


Weekly Technical Trade Levels on USD Majors, Commodities & Stocks
- Technical trade setups we are tracking into the start of the week on the USD Majors, commodities, bitcoin, and equity indices into the close of the month.
- Event risk on tap: Iran war headlines, Eurozone CPI, US retail sales, ADP, & NFP
- Next Weekly Strategy Webinar: Monday, April 13 at 8:30am ET
- Review the latest Video Updates or Stream Live on my YouTube playlist
In this webinar we take an in-depth look at the technical trade levels for the US Dollar (DXY), Euro (EUR/USD), British Pound (GBP/USD), Australian Dollar (AUD/USD), Canadian Dollar (USD/CAD), Japanese Yen (USD/JPY), Swiss Franc (USD/CHF), Gold (XAU/USD), Crude Oil (WTI), and Bitcoin (BTC/USD), and S&P 500 (SPX500), Nasdaq (NDX), and Dow Jones (DJI). These are the levels that matter on the technical charts into the weekly open.
US Dollar Price Chart – USD 240min (DXY)
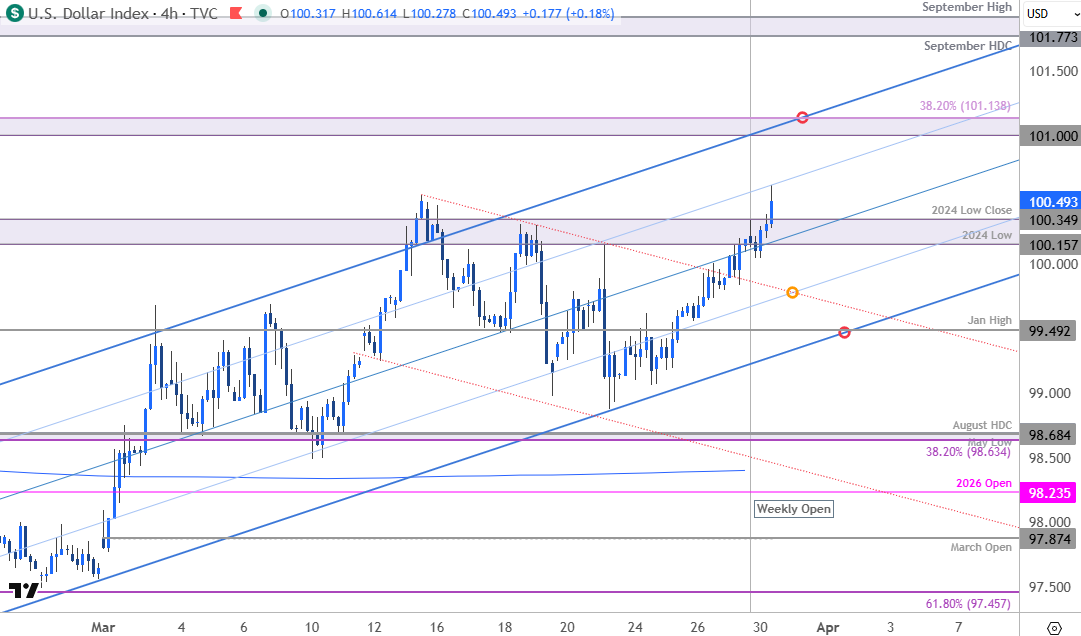
Chart Prepared by Michael Boutros, Sr. Technical Strategist; DXY on TradingView
Notes: The US Dollar Index is attempting to break above pivotal resistance at 100.16/34- a region defined by the 2024 Low, the August high, the November high-close, and the 2024 low-close. A daily close above this region would keep the advance viable with subsequent resistance objectives eyed at the 38.2% retracement of the 2025 decline at 101.00/14 and the September 2024 high / high-day close (HDC) at 101.78/92. Initial support rest at the highlighted slope confluence near 99.70s with near-term bullish invalidation now raised to the January high at 99.49.
Bottom Line: The US Dollar is testing a major pivot zone today and a close above this zone would threaten resumption of the late-January uptrend. From a trading standpoint, losses would need to be limited to 99.49 IF the index is heading higher on this stretch with a close above the 75% parallel needed to fuel the next leg of the advance towards 101.
Keep in mind it’s a shortened holiday week with key data prints on tap in the days ahead. US retail sales & APD employment are slated into the April open on Wednesday, with Non-Farm Payrolls on tap Friday when US markets will be offline. Stay nimble into the monthly cross and watch the weekly close here for guidance.

Australian Dollar Price Chart – AUD/USD 240min
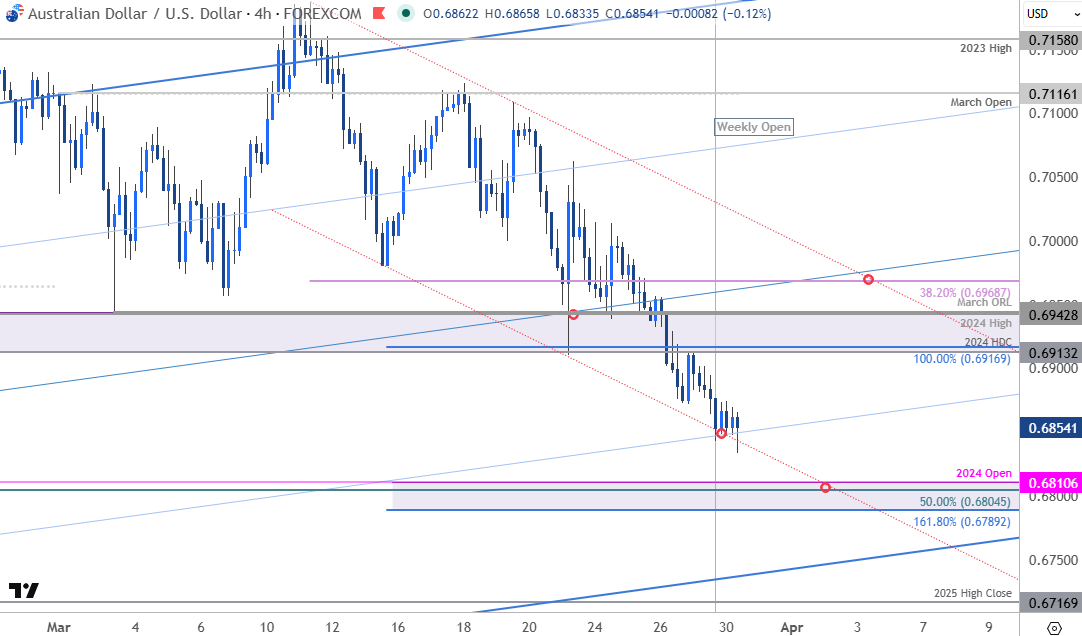
Chart Prepared by Michael Boutros, Sr. Technical Strategist; AUD/USD on TradingView
Notes: Aussie broke below key support last week at 6913/43- a region defined by the 2024 high-day close (HDC), the 100% extension of the monthly decline, the 2024 swing high, and the March low. The decline is testing confluent slope support into the start of the week at ~6840s and while the near-term outlook remains weighted to the downside, this region could produce some kickback. The next major support zone is eyed at 6790-6810 where the 161.8% extension, the 50% retracement of the November advance and the objective yearly open converge. Look for a larger reaction there IF reached.
Initial resistance is now eyed back at former support with near-term bearish invalidation lowered to the 38.2% retracement of the monthly decline near 6969. Note that channel resistance converges on this level later this week and a breach / close above this slope would be needed to suggest a more significant near-term low is in place.
Bottom line: Aussie broke below key support at the monthly opening-range lows last week and keeps the risk weighted to the downside heading into the close of the March. From a trading standpoint, rallies would need to be limited to 6969 IF price is heading lower on this stretch- look to reduce short-exposure / lower protective stops on a test of 6790-6810. A larger reaction in price there could offer further guidance on the Aussie outlook heading into April IF reached.
Economic Calendar – Key Data Releases
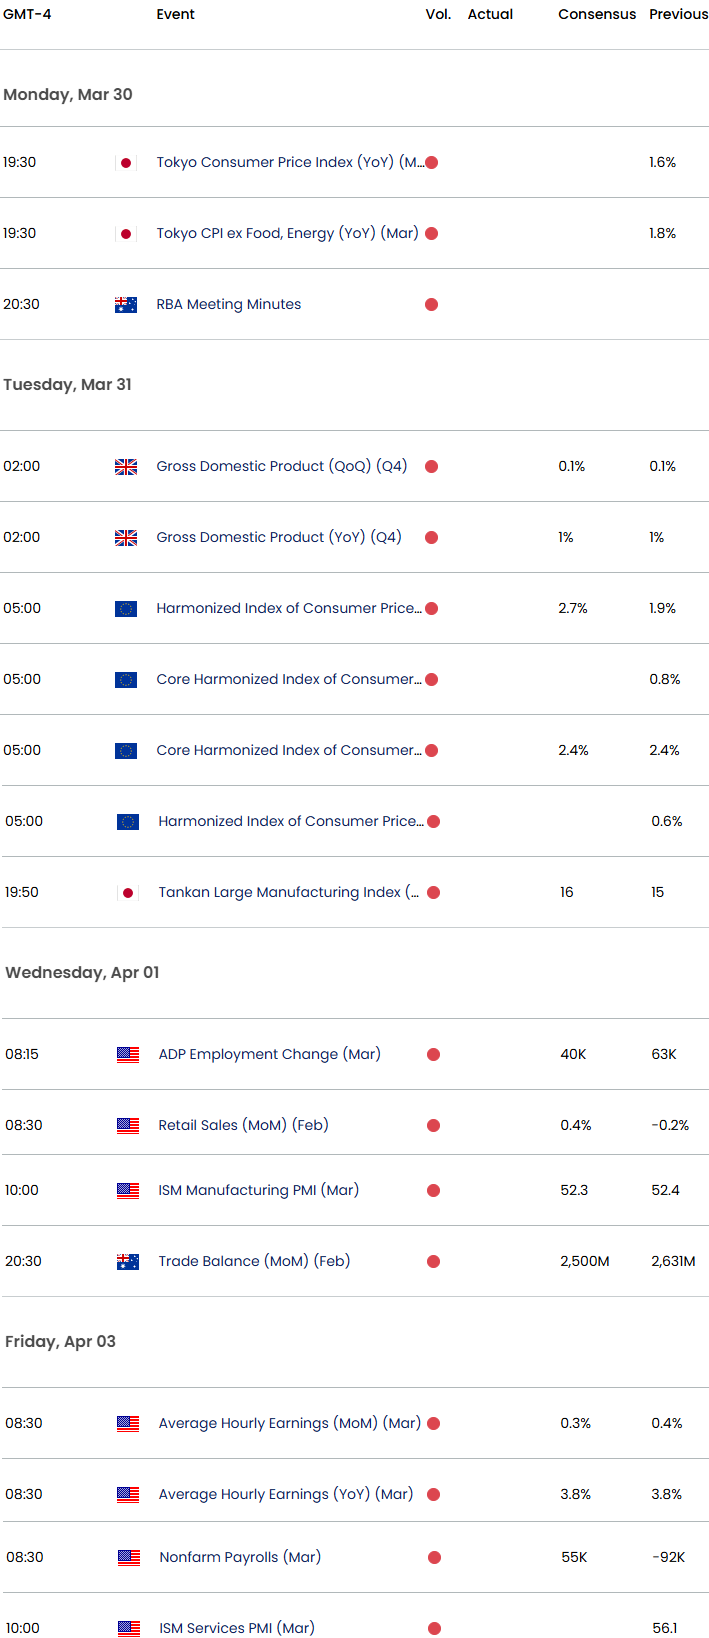
Economic Calendar - latest economic developments and upcoming event risk.
--- Written by Michael Boutros, Senior Technical Strategist
Follow Michael on X @MBForex






