
USD/JPY Talking Points:
- USD/JPY has broken above and held above the 160 level and of late it’s been the 161.95 level that’s been of contention.
- USD/JPY has been one of the more attractive majors for USD-strength and I retain that view as we trade into the second half of the year.
- For this week it’s all about CPI, and a hot reading here could stoke rate hike potential in the US which could further prod USD-strength and, in turn, USD/JPY gains.
For a while now my favored major pair for USD-strength is USD/JPY, and that remains in force as we trade into the second half of the year. At this point USD/JPY is on the verge of fresh 40-year highs and the next obvious waypoint along the way is the 165.00 handle that was last in-play back in 1986.
USD/JPY Monthly Price Chart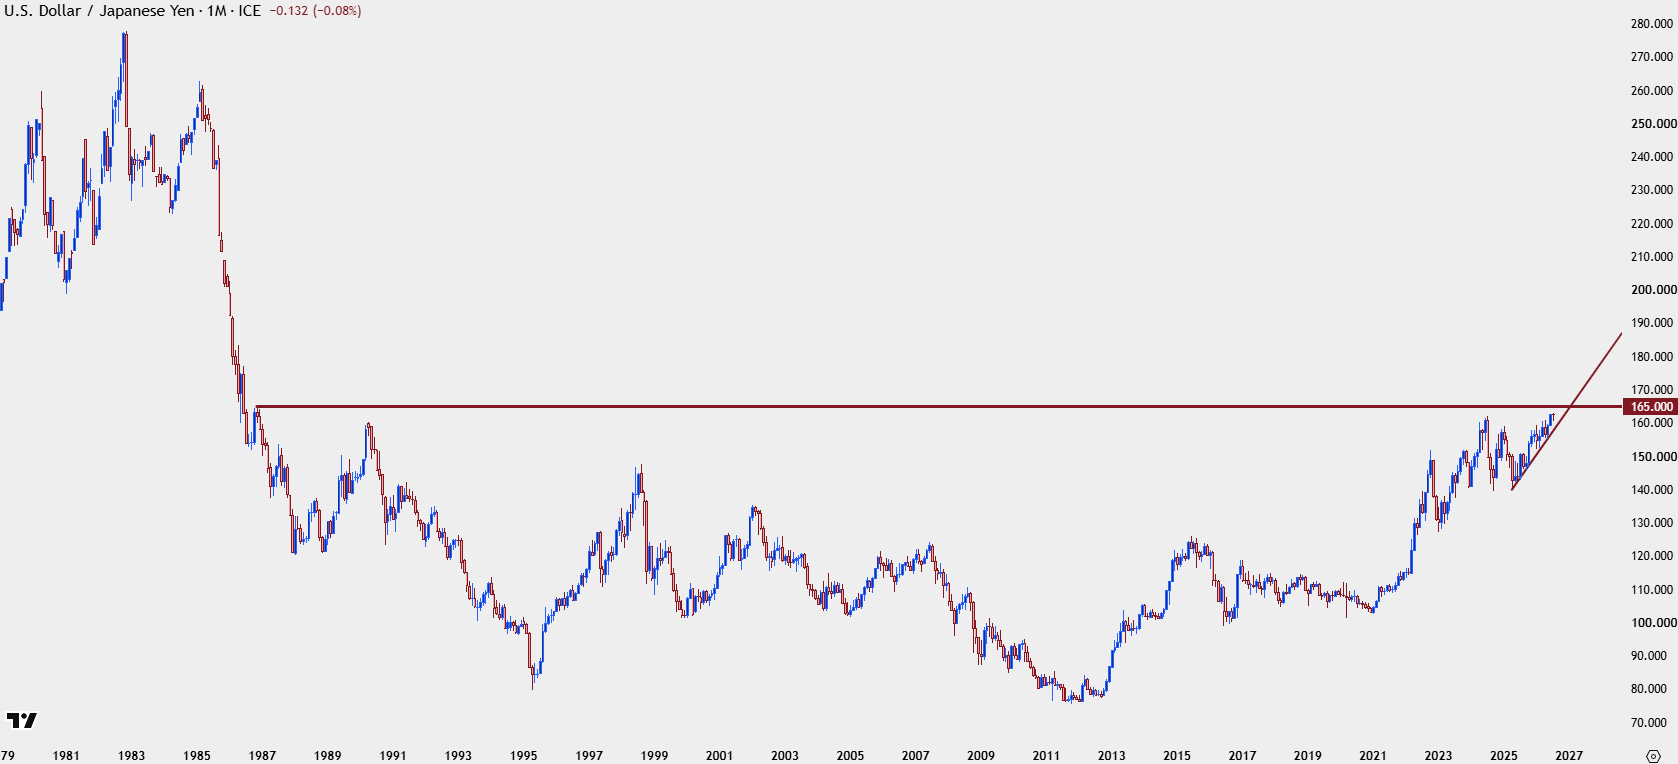
Chart prepared by James Stanley; data derived from Tradingview
As inflation forces have continued to uptick in the US the disparity between American and Japanese monetary policy keep that as a major theme, and I think there’s quite a bit of misunderstanding amongst retail traders around the background for such a move. Even this morning on social media I had someone remark that Japanese policymakers wouldn’t allow for the USD/JPY spot rate to push past 163, for a few different reasons.
But what I think is often missed is the fact that it’s a free market and that’s not entirely up to just one or two decision makers, and the going price is the going price as that’s what’s determined by the market with known facts at a given point in time. Yes, those facts can change, but the true reason for the trend and the rationale for why price is above 160.00 is the disparity between rate regimes of the two nations.
Japan has been hesitant to hike rates too quickly as that threatens to not only choke off growth, but to invite back the disinflation or even deflationary symptoms that have plagued the nation for much of the past thirty-plus years. So while they could effectively hike rates to strengthen the Yen, there’s consequences that they likely don’t want to deal with of that avenue.
If US rates are at 3.5% and Japanese rates at 1.0%, there’s opportunity there, as a hedge fund can go to a Japanese bank and borrow at a low rate and then invest that capital elsewhere at a higher rate, pocketing the spread. The only problem at that point is they’re essentially long Yen which risks whatever spread might exist.
The types of market players to exploit this disparity aren’t usually the type that just sit in a hedge, so they’ll try to be pragmatic about it, looking to buy dips or bid support rather than just chasing breakouts to offset the risk of a weakening Yen. This rate disparity invites a reason for demand to stick around, through short-term market cycles, such as we’ve seen for the past few years.
Well, Why Don’t They Just Intervene?
This is where I think a lot of the retail confusion comes from, as interventions can obviously bring counter-trend moves such as we’ve seen multiple times in the past few years. But they are far from a panacea, and really, they’re a contortion of logic and financial drive.
As noted above as long as there’s disparity investors are being incentivized to borrow cheaply from Japan and then invest elsewhere to pocket the spread. USD/JPY is just more of a representation of that as an investor doesn’t want to take on the currency risk so they offset that with a hedge.
For those investors, intervention can be a desirable thing, as it makes the hedge cheaper and allows for the longer-term trend to continue from a more advantageous entry point. But for the intervening nation, that stop run amounts to burning finite capital reserves to produce a pullback that didn’t last.
So, perhaps the primary hope for intervention, considering that Japanese policymakers likely want to avoid up-ending their growth projections by aggressively hiking rates, is that US inflation calms or slows down to the point where that rate differential can narrow with US rate cuts, or at the least, slower US rate hikes.
This is what happened back in 2022. It is not what is happening right now.
USD/JPY Weekly Price Chart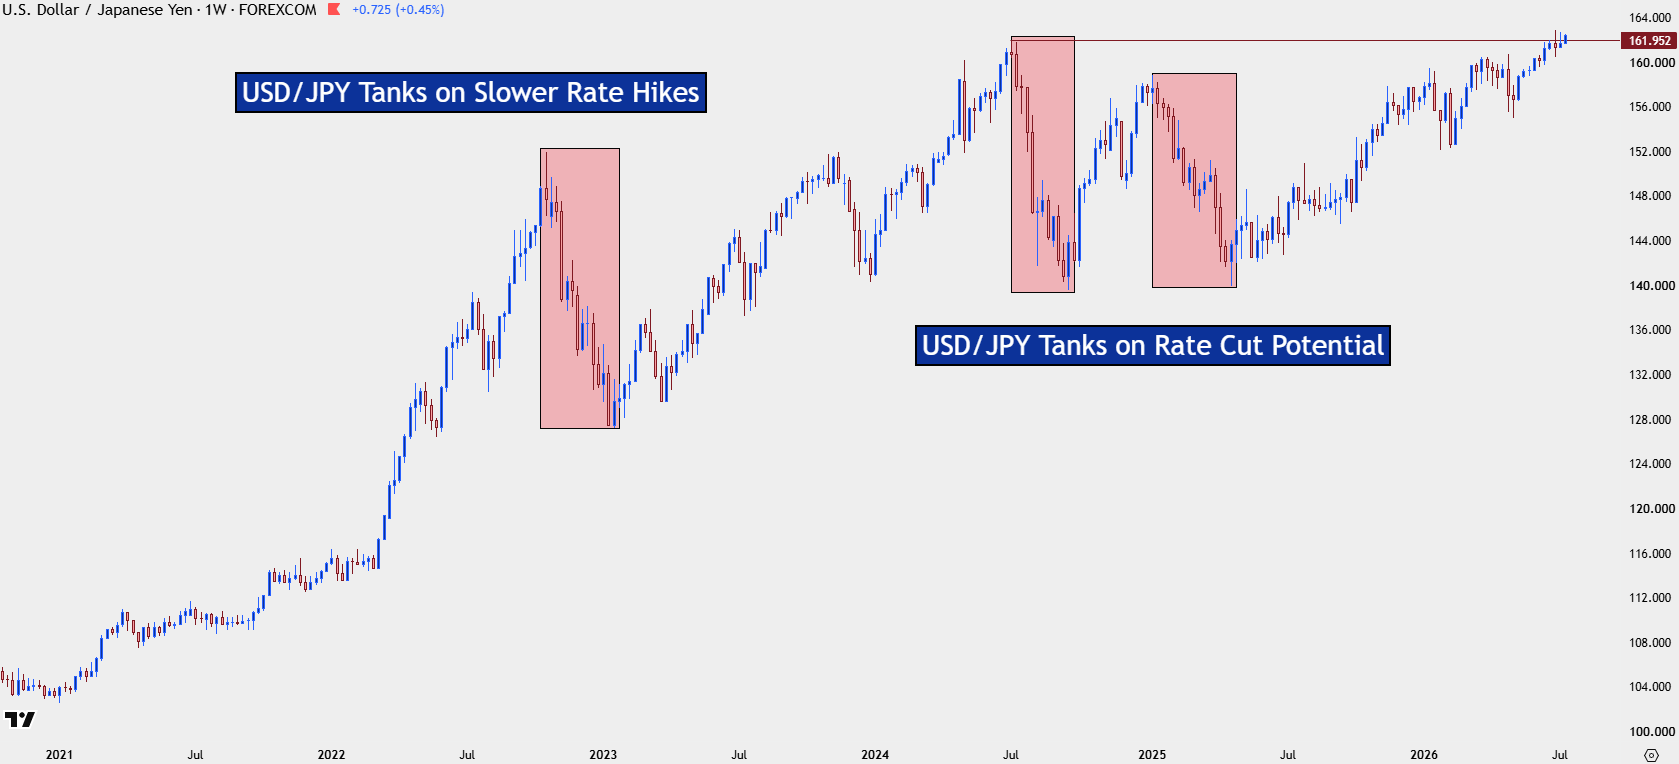
Chart prepared by James Stanley; data derived from Tradingview
Tactical Strategy and Short-Term Dynamics
The benefit of longer-term charts such as the monthly and weekly varieties shown above is they have a tendency to downplay or mute much of the noise that’s ever-present on shorter-term charts.
Oftentimes there can appear a disconnect between the two, but if reconsidered from a different perspective this can also be seen as possible opportunity, similar to how a hedge fund holding a hedge position in USD/JPY for a carry trade might look at the matter. The big item around the US Dollar this week is an incoming CPI print. If this comes out hot, logically, odds can build for a possible rate cut from the Fed this year, which has helped the USD to stay relatively strong.
That CPI print is unpredictable, just as price is; but – if it does come out below expectations and we see odds for a rate hike temper a bit, that could create a pullback, and this pullback is where the opportunity may show for a trader looking at the big picture. There’s a few contingencies that must be considered, however, as even the reaction to that unpredictable CPI print is also unpredictable.
On a big picture basis the prior resistance zone of 158.88-160.00 would be an attractive area for support to show from prior resistance. That’s quite far from price, however, and there’s already been a couple of higher-lows above that area, so if it does come into play we’d probably need to see a slow CPI print and perhaps even some Fed-speak talking up rate cut potential. While this might seem like an outlier, we have to keep in mind that Kevin Warsh was just nominated by President Trump with a keen eye on rate cuts ahead of mid-terms. So, it’s a possibility that must be considered.
Above that, at 160.73, we have a spot of prior resistance that’s already shown as support. For a deeper pullback scenario, this would be the ideal spot for bulls to step in, disallowing for a re-test of the big figure at 160.00. This would illustrate some optimism from buyers in responding to a dip if they don’t even allow for prices to drop all the way to the psychological level.
And on that note, 161.95 should be considered, as this was the high back in 2024 and it’s since come in as resistance which bulls are still battling with today. This would be a nearby and shorter-term area of support, but if the trend remains strong and those ‘big picture’ bulls remain on the sidelines looking to take advantage of short-term weakness to bid long-term strength, that’s a spot of support potential that could possibly be worked with.
USD/JPY Daily Chart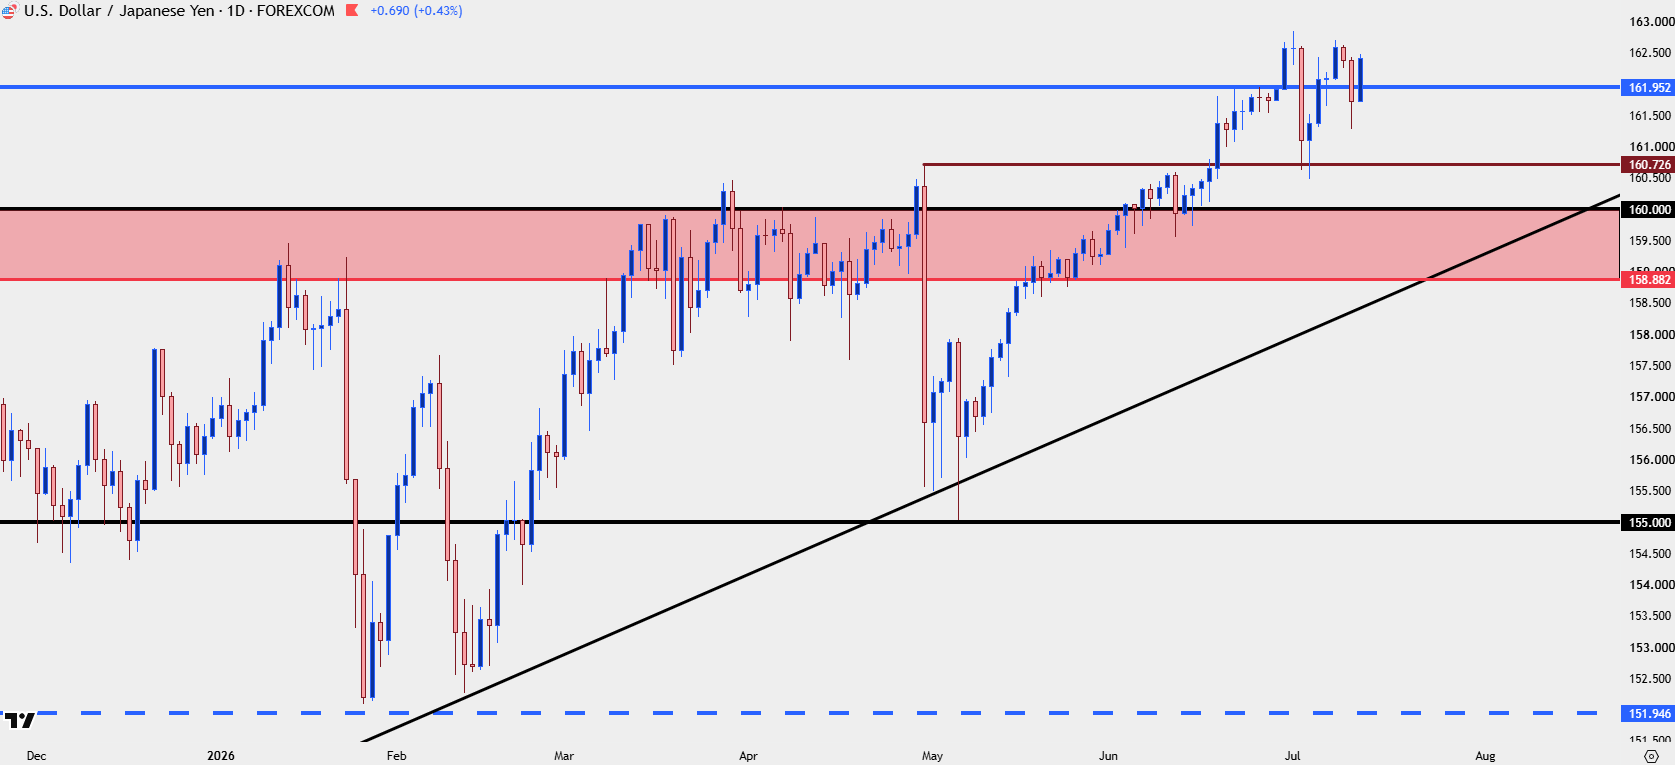
Chart prepared by James Stanley; data derived from Tradingview