


USD/JPY has broken above the 160 handle for the first time since 2024 and this sets up for a volatile Sunday open. Meanwhile, the US Dollar retains breakout potential given the ascending triangle formation and for those looking to fade DXY, EUR/USD is grasping at the 1.1500 level.
With a few hours until the close of trading for the week the USD/JPY pair has pushed above the 160.00 level that was twice defended in 2024. Since then, bulls haven’t wanted to go for a test for fear of another intervention-fueled stop run, but now with bulls taking a step above that level we must entertain a few possible scenarios for the Sunday open, and we have some prior illustrations to work from.
Back in 2024 the pair tested 160.00 for the first time in decades after a Sunday open. The BoJ intervened and for the rest of that week sellers remained in control, eventually with price pulling all the way back to 151.95. That price set the low, bulls came back, and price was back above 160.00 a couple months later.
USD/JPY Weekly Price Chart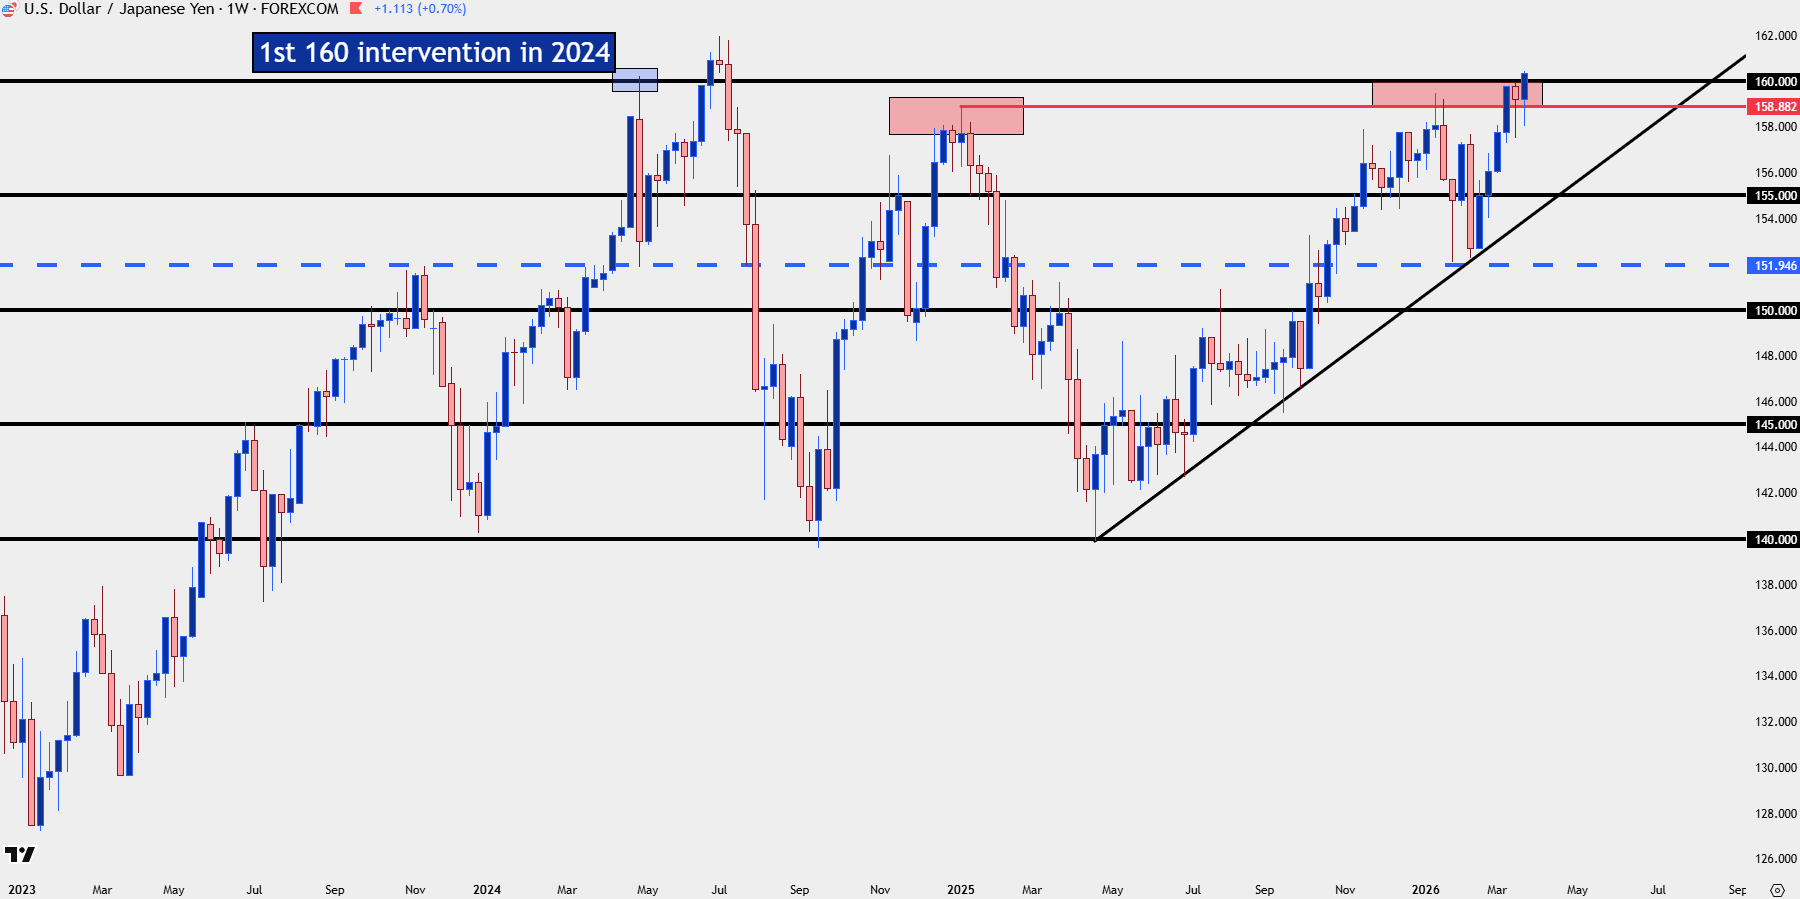
Chart prepared by James Stanley; data derived from Tradingview
USD/JPY 2022 Episode
With no intervention yet there’s the possibility that the line-in-the-sand may simply have been drawn back, and there’s prior illustration of this, as well.
Back in 2022 when the Fed was continuing to hike rates the USD/JPY pair had held a massive rally that saw more than 3000 pips added to the spot quote. As we came into September, the verbal intervention threats from the MoF had started and the line in the sand was thought to be at the 145.00 level. This was so widely believed that that price held as resistance for about a month, but, eventually, bulls started to test above it and once they did, price went right up to the 150.00 handle at which point the BoJ was forced to intervene on a very volatile Friday morning.
The high from that year of 151.95 remained a big spot as this set the high a year later and then was a critical swing low after the 160.00 intervention mentioned above.
And then in 2024 when prices did push that second 160.00 test, they ran all the way up to a high of 161.95, 1,000 pips above that prior swing level before stalling out again.
This is relevant for two reasons: First, if we do see the breakout continuing to run it’s that 161.95 level that stands out as next resistance. But second, and perhaps most important is the way the BoJ had intervened on that second test above 160.00, which was on the morning of a US CPI report and that unwind eventually drove a massive global equity sell-off.
USD/JPY Daily Chart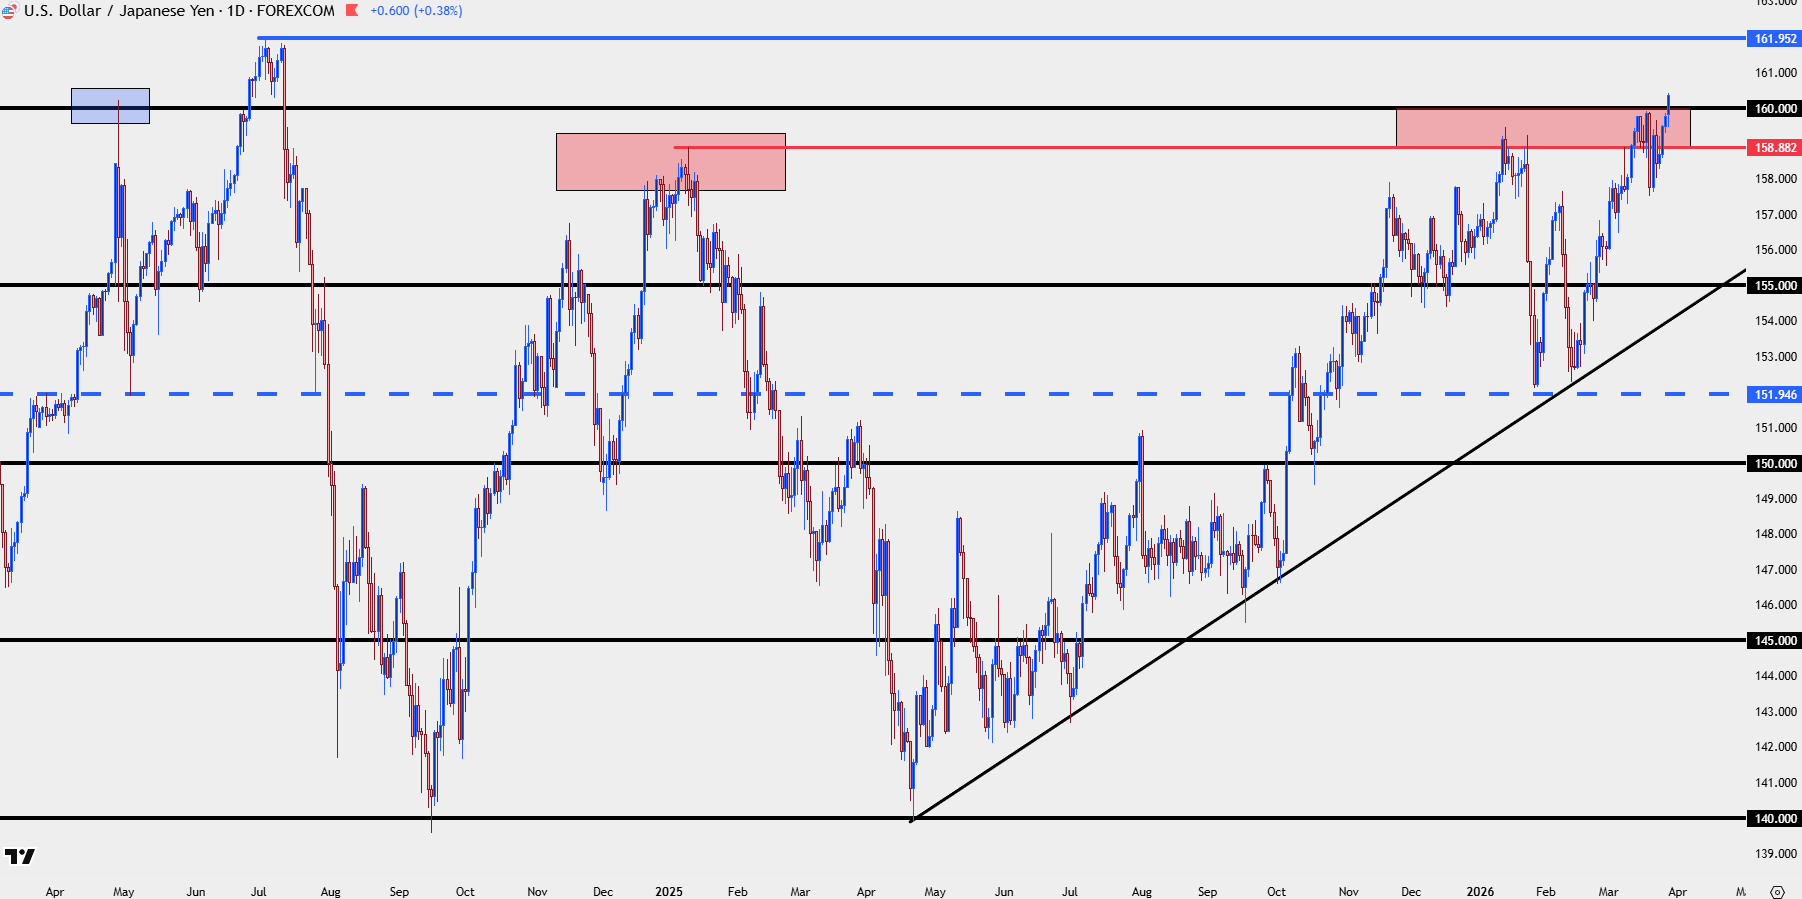
Chart prepared by James Stanley; data derived from Tradingview
USD
The US Dollar retains an ascending triangle formation and this is related to the same formation that had built into late-February.
For this breakout to hit I think we’d need to see the bullish scenario prevail in USD/JPY, with breakouts showing in both markets. The technical backdrop is there as shown from the below daily chart with yet another test in DXY at 100.22.
US Dollar Ascending Triangle Formation – Daily Chart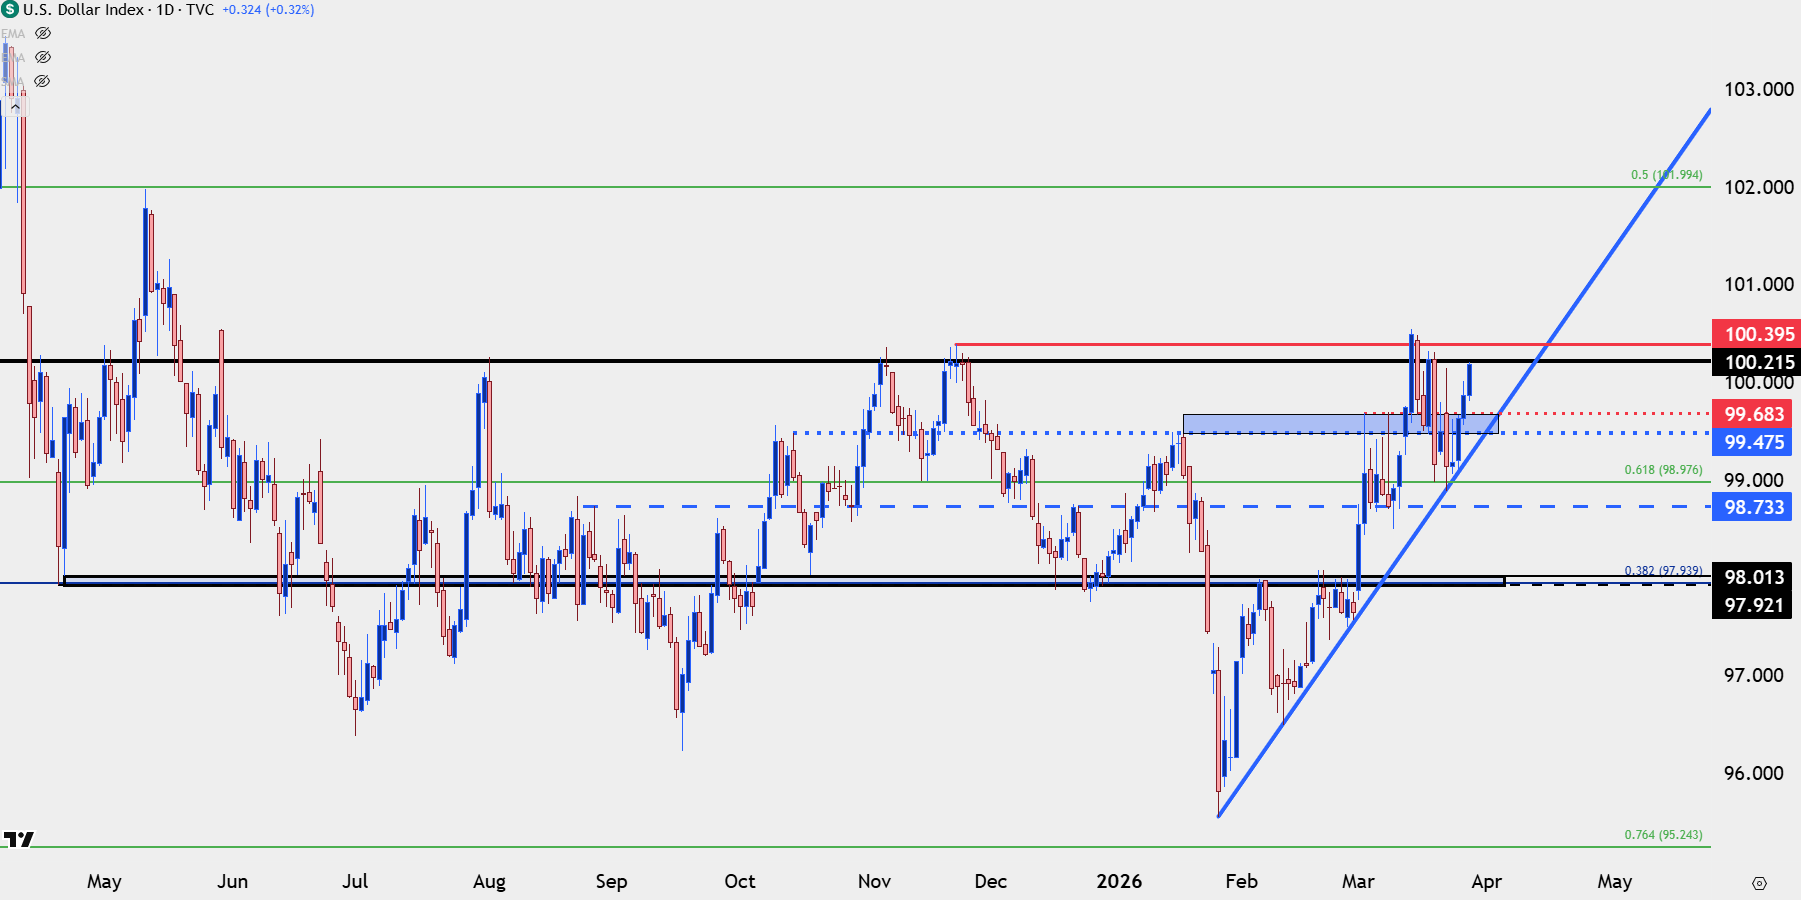
Chart prepared by James Stanley; data derived from Tradingview
EUR/USD
If looking to fade the USD move, EUR/USD may be a more attractive venue as there’s been a build of bullish structure on shorter-term charts. As of this writing, it’s the 1.1500 level that’s of interest but realistically a hold above 1.1411 keeps that door open, and preferably a hold of 1.1451.
EUR/USD Four-Hour Price Chart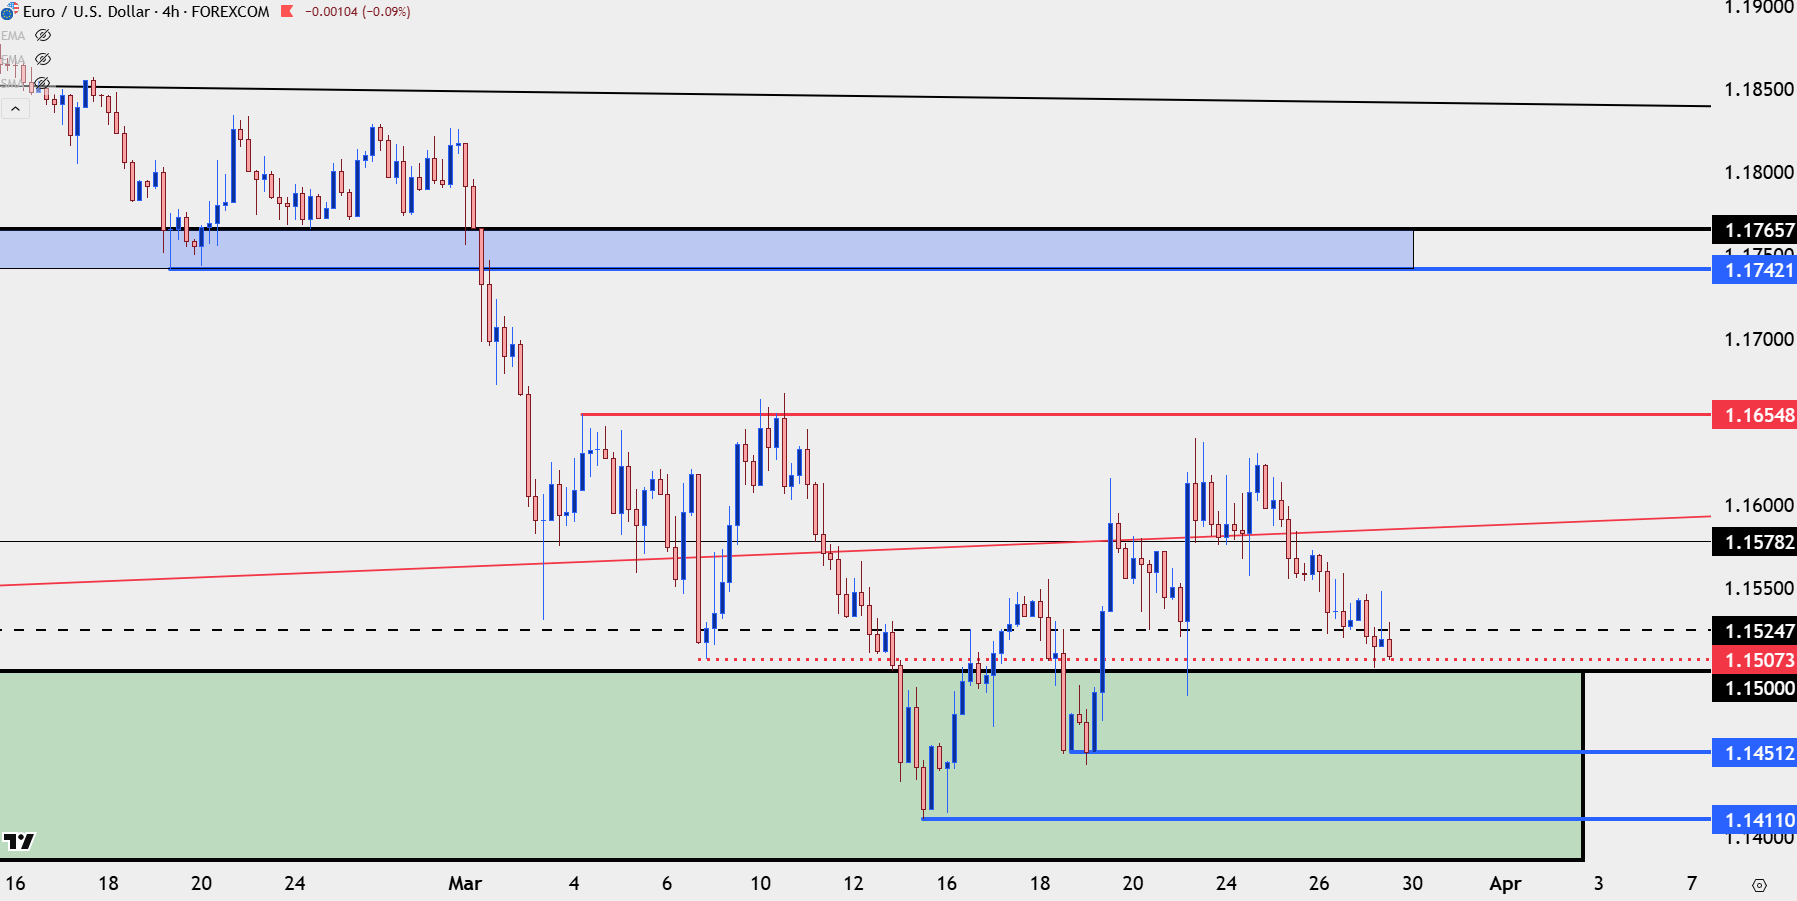
Chart prepared by James Stanley; data derived from Tradingview
--- written by James Stanley, Senior Market Analyst, Global Macro






