


Motion creates emotion and the massive rally in the US Dollar has certainly created several headlines that add a bit of noise to the matter. In the effort of balance, I tried to look at setups on either side of the matter for this webinar and highlighted both gold and EUR/USD shorter-term setups.
In the US Dollar, the ascending triangle that I’ve been following broke out in a big way to start this week, and already bulls have pushed price up to resistance at the 99.50 level.
The next resistance overhead is a major spot – the same that held back buyers three separate times last year in August and then twice in November. If bulls can break above that, we can see some pretty major shifts in markets like stocks and gold but, for now, that’s overhead resistance. And support is the 97.94 Fibonacci level that held the highs in the ascending triangle before this week’s breakout.
US Dollar Four-Hour Price Chart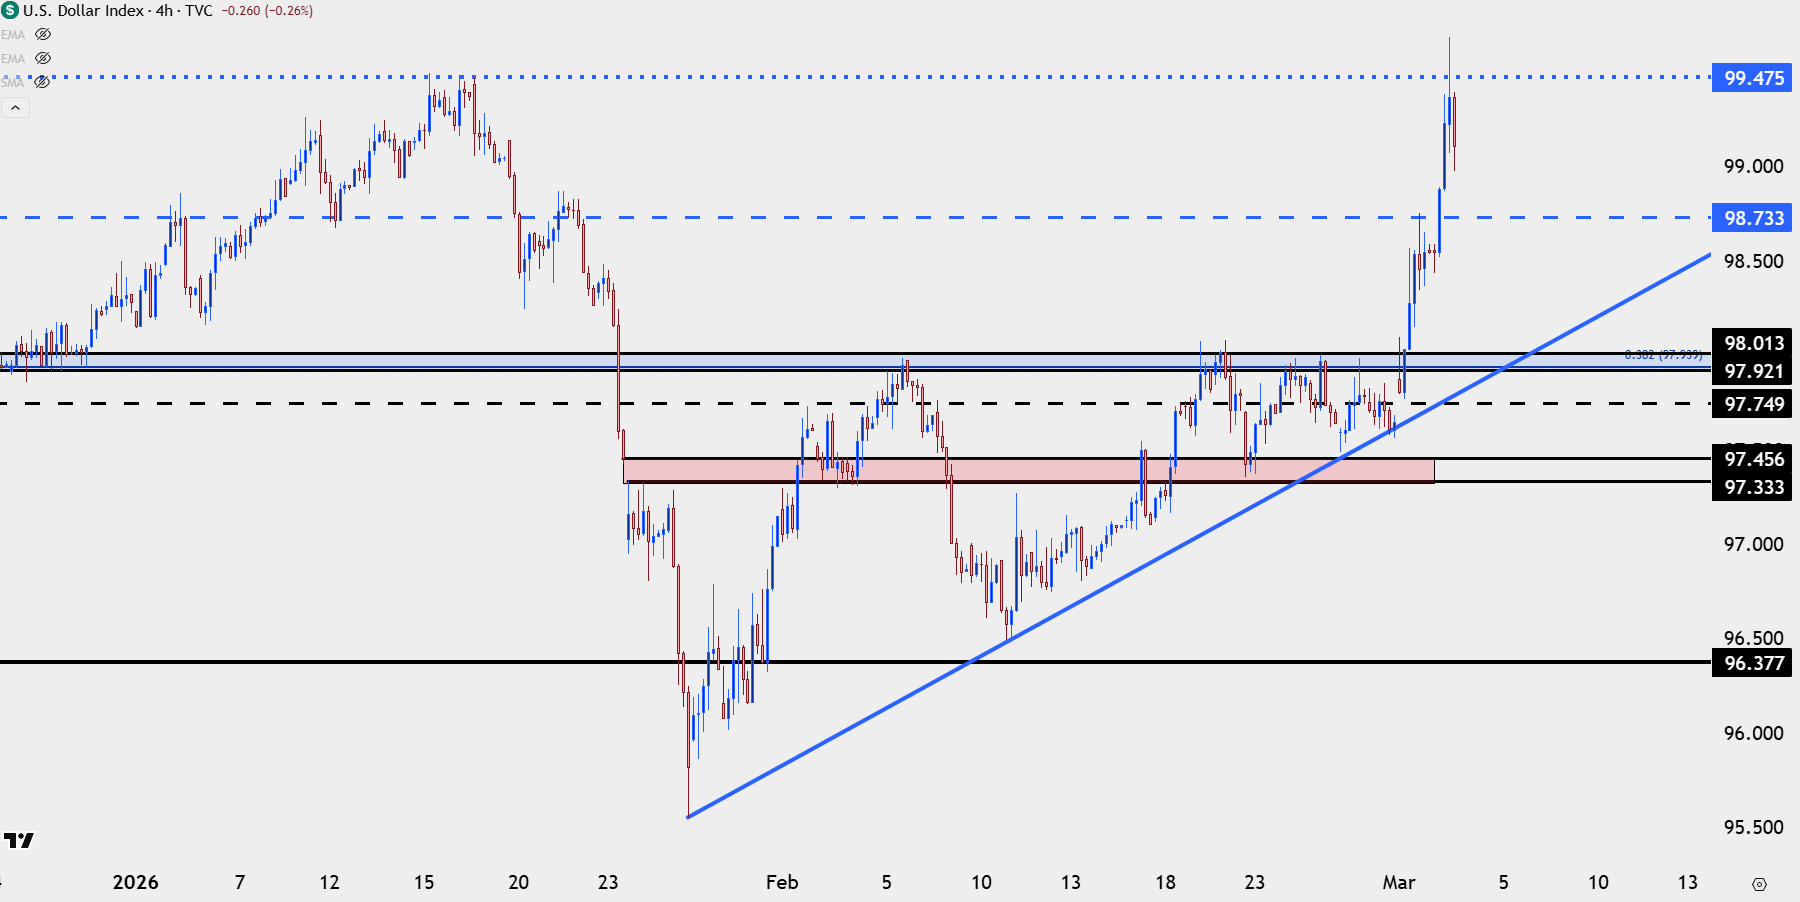
Chart prepared by James Stanley; data derived from Tradingview

EUR/USD Takes Over on USD
While USD/JPY has seemed to be a main push point for the US Dollar and the DXY basket as a whole of late, it’s the breakdown in EUR/USD that’s seemed to have the bigger push on the US Dollar so far this week.
As shared in the webinar I think this roots from the way the US has went about attacks in Iran, as this is yet another step away from the US-NATO relationship and something that takes a bit of importance away from the Euro.
That said, this is all still very early and the thesis that many are espousing, how higher energy prices are at the source of the move, doesn’t quite fit as higher energy prices are likely to boost inflation expectations which, in turn, remove some of the ECB’s ability to cut rates.
Nonetheless, price is price, and EUR/USD seems to be trying to find it’s footing and while this doesn’t necessarily suggest full-fledged reversal, it does open the door for a pullback and a test of a lower-high. For that lower-high potential, it’s the Fibonacci level at 1.1686 that stands out with the prior support of 1.1748 sitting above that.
EUR/USD Four-Hour Chart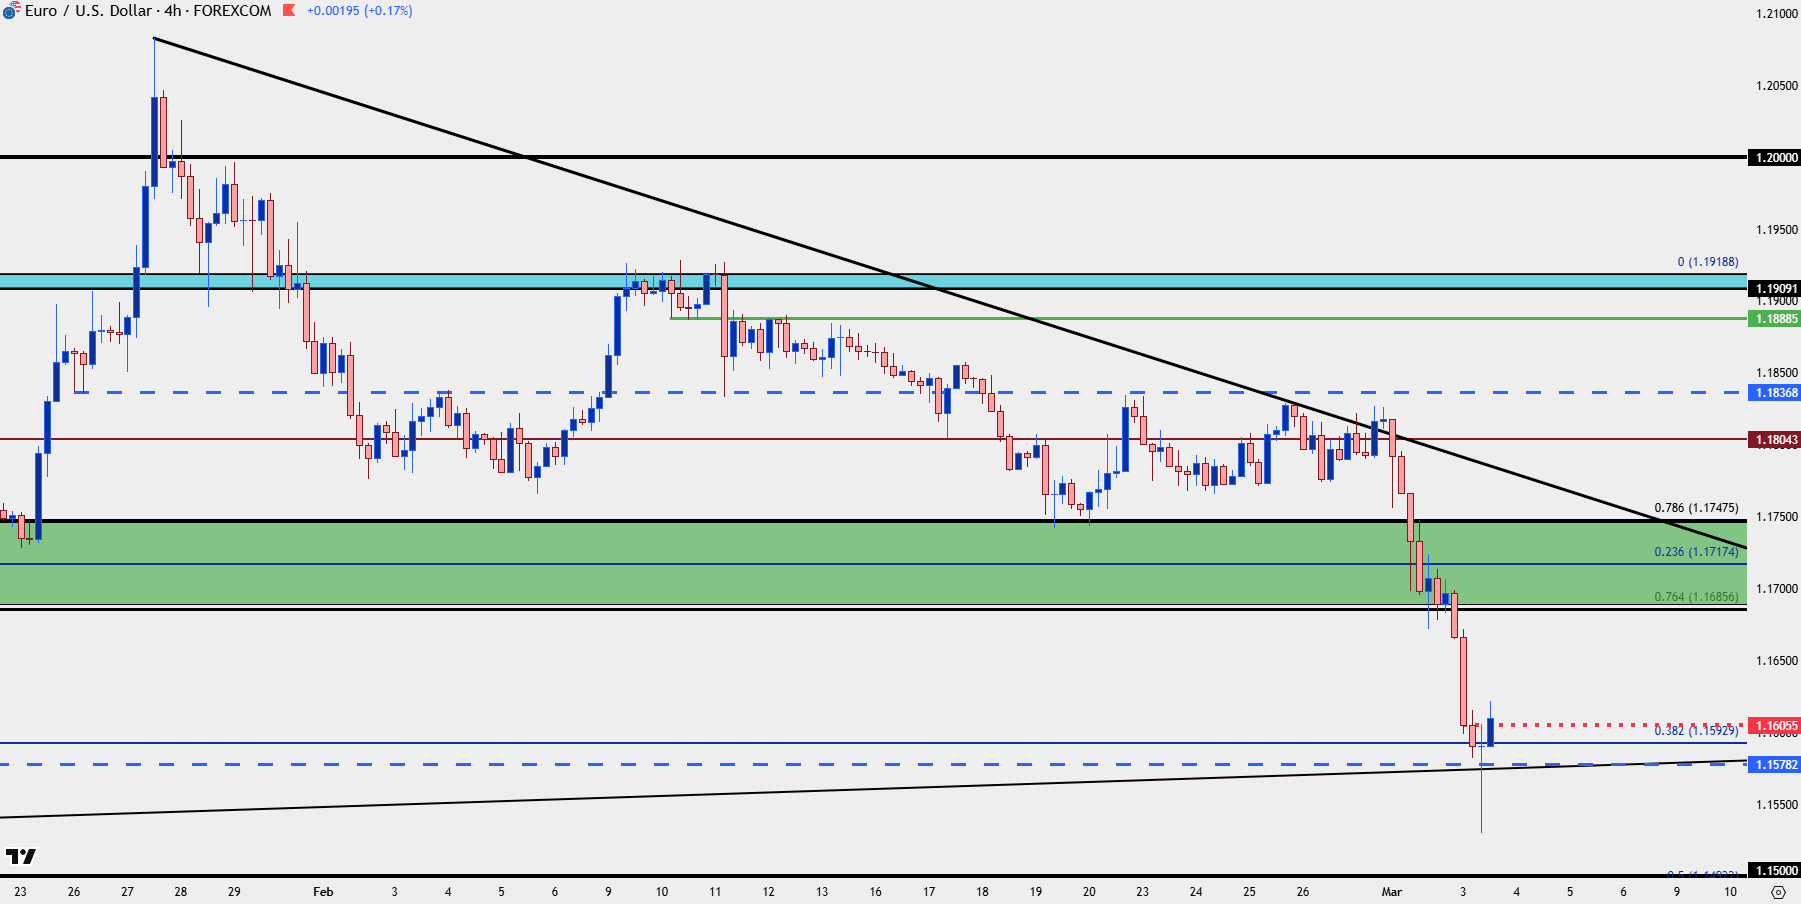
Chart prepared by James Stanley; data derived from Tradingview
GBP/USD
Cable was similarly hit hard and negated the falling wedge formation that had held into last week’s close, but so far the 1.3250 level has stood up as support. The 1.3414-1.3434 levels now produce a zone for lower-high resistance, and this is what bulls would need to take out to make a more convincing drive for a bullish reversal.
GBP/USD Four-Hour Chart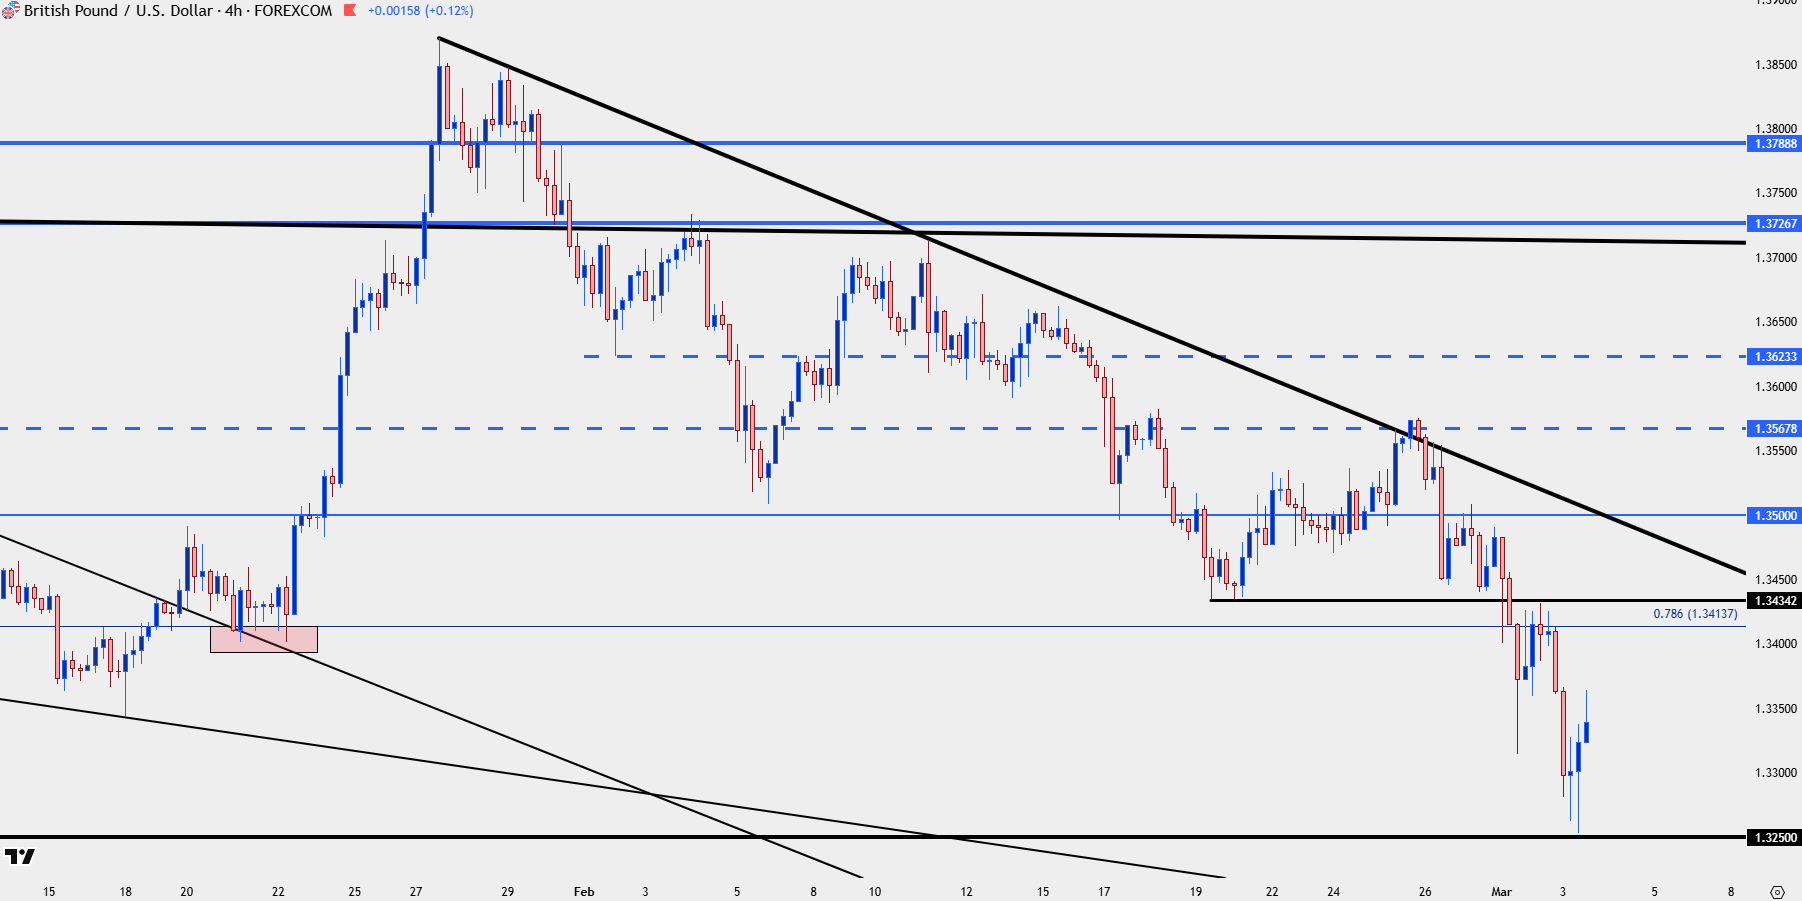
Chart prepared by James Stanley; data derived from Tradingview

USD/JPY
While the unfurling of the Euro has been a big push point for the USD, it’s the Japanese Yen that could unsettle the trend. The pair is now testing the same highs that held resistance in February and just overhead are a couple of spots that so far bulls haven’t had much success with, and these post right around the 159.00 level with the 160.00 level lurking above that.
Like we saw in late-January, a reversal in USD/JPY can have an outsized impact on the DXY basket and that can, in-turn, push pairs like EUR/USD and GBP/USD.
For now, the short-term trend remains bullish and there’s higher-low support potential at 156.27, 154.45-155.00 and then 153.67. If the 151.95-152.50 zone gets taken out we can be looking at a remarkably different picture very soon.
USD/JPY Daily Chart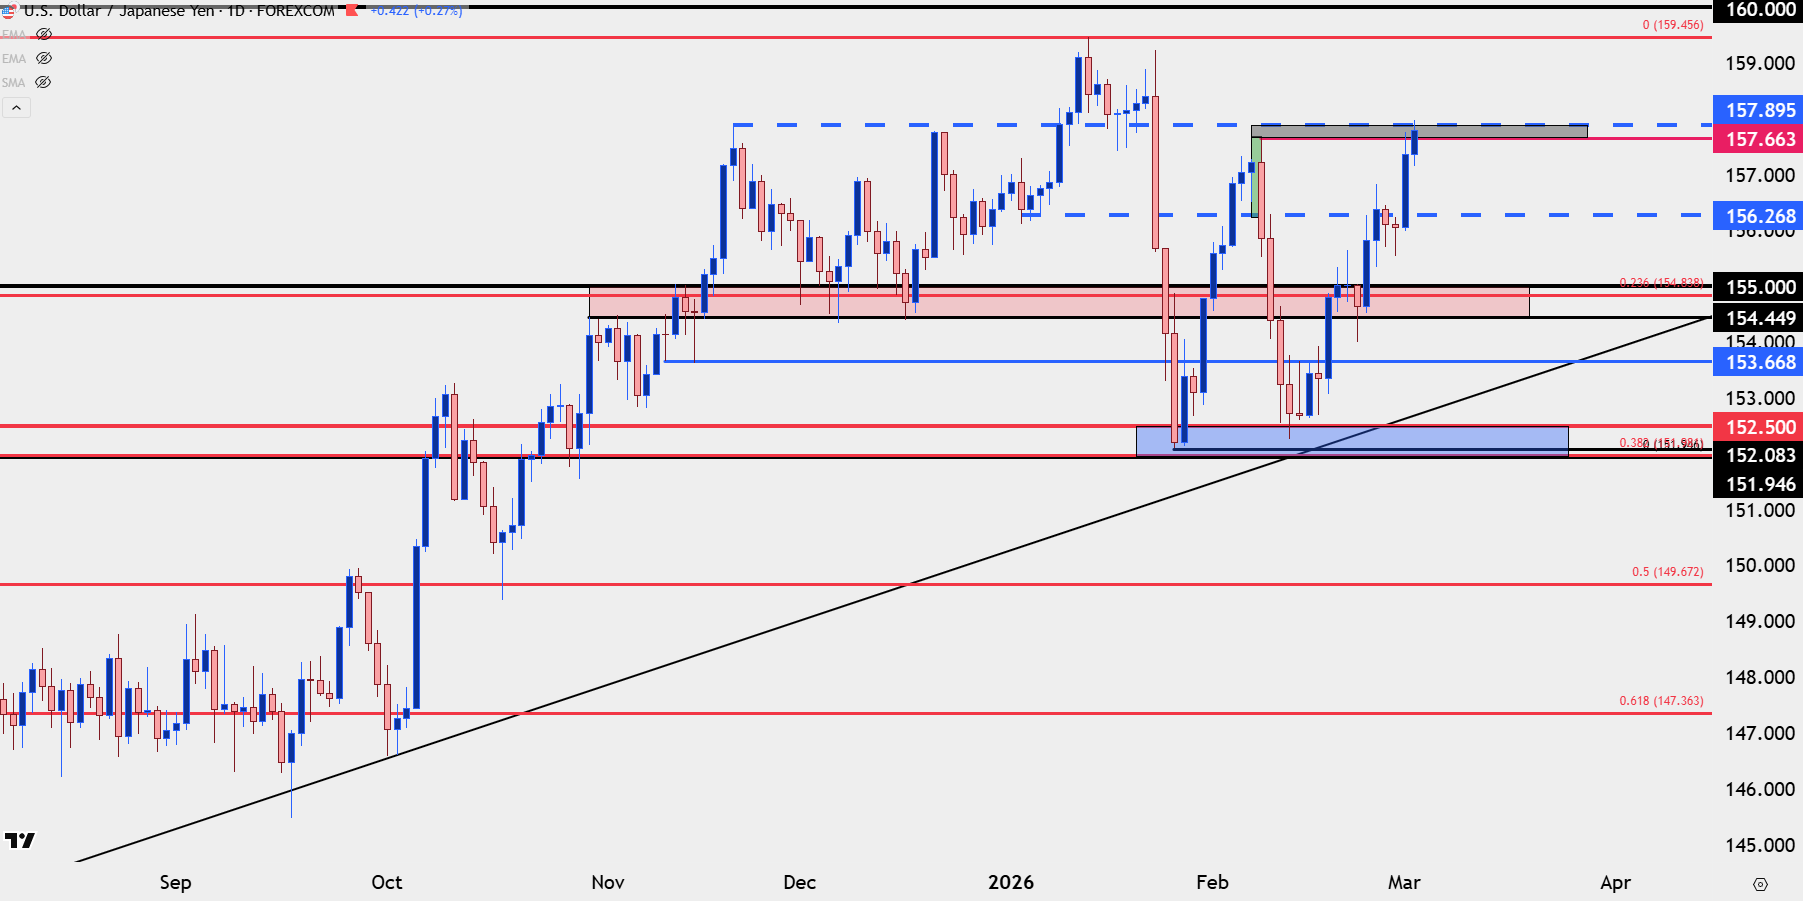
Chart prepared by James Stanley; data derived from Tradingview
Gold
Gold started off the week with strength, but prices have peeled back aggressively so far today. So far, the 5k level has held the lows and as shown in the webinar, it’s the 5100 area that sets up for possible higher-low support which remains in-play as of this writing.
Gold 30-Minute Chart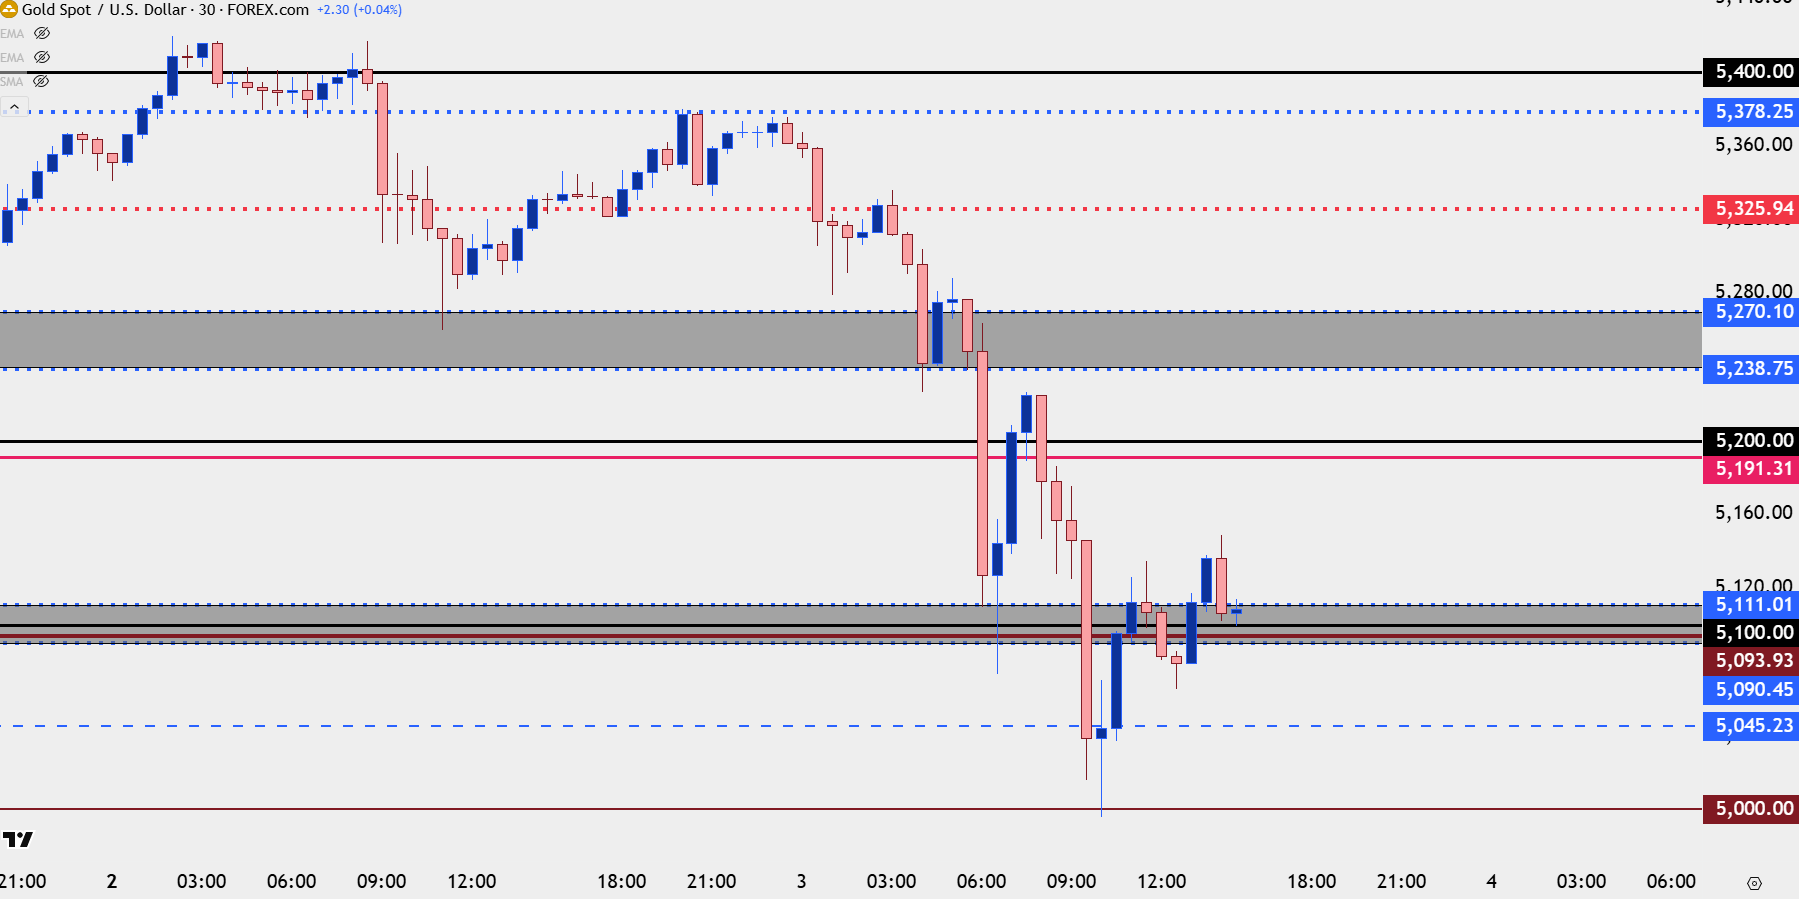
Chart prepared by James Stanley; data derived from Tradingview
--- written by James Stanley, Senior Market Analyst, Global Macro






