


Over the last two trading sessions, USD/CAD has posted a consistent gain of more than 0.3% in the short term, marking a renewed bullish bias in the market.
Buying pressure has emerged as the US dollar shows renewed strength as a safe-haven asset amid recent tensions in the Middle East. At the same time, expected central bank dynamics point to a firmer Federal Reserve stance, causing the Canadian dollar to lose ground consistently. If this behavior continues in the coming sessions, it could become a key factor supporting more meaningful buying pressure in USD/CAD.

Tensions Continue
We are now in day 13 of the Middle East conflict, and for now there appears to be no consistent short-term resolution. Recent updates highlight increased attacks on vessels and further navigation restrictions through the Strait of Hormuz, significantly affecting maritime oil trade.
Additionally, explosions have been reported in Dubai as part of the ongoing escalation, while WTI crude has once again surpassed the $100 level. This development has not only intensified geopolitical tensions but also increased expectations of short-term inflationary pressures.
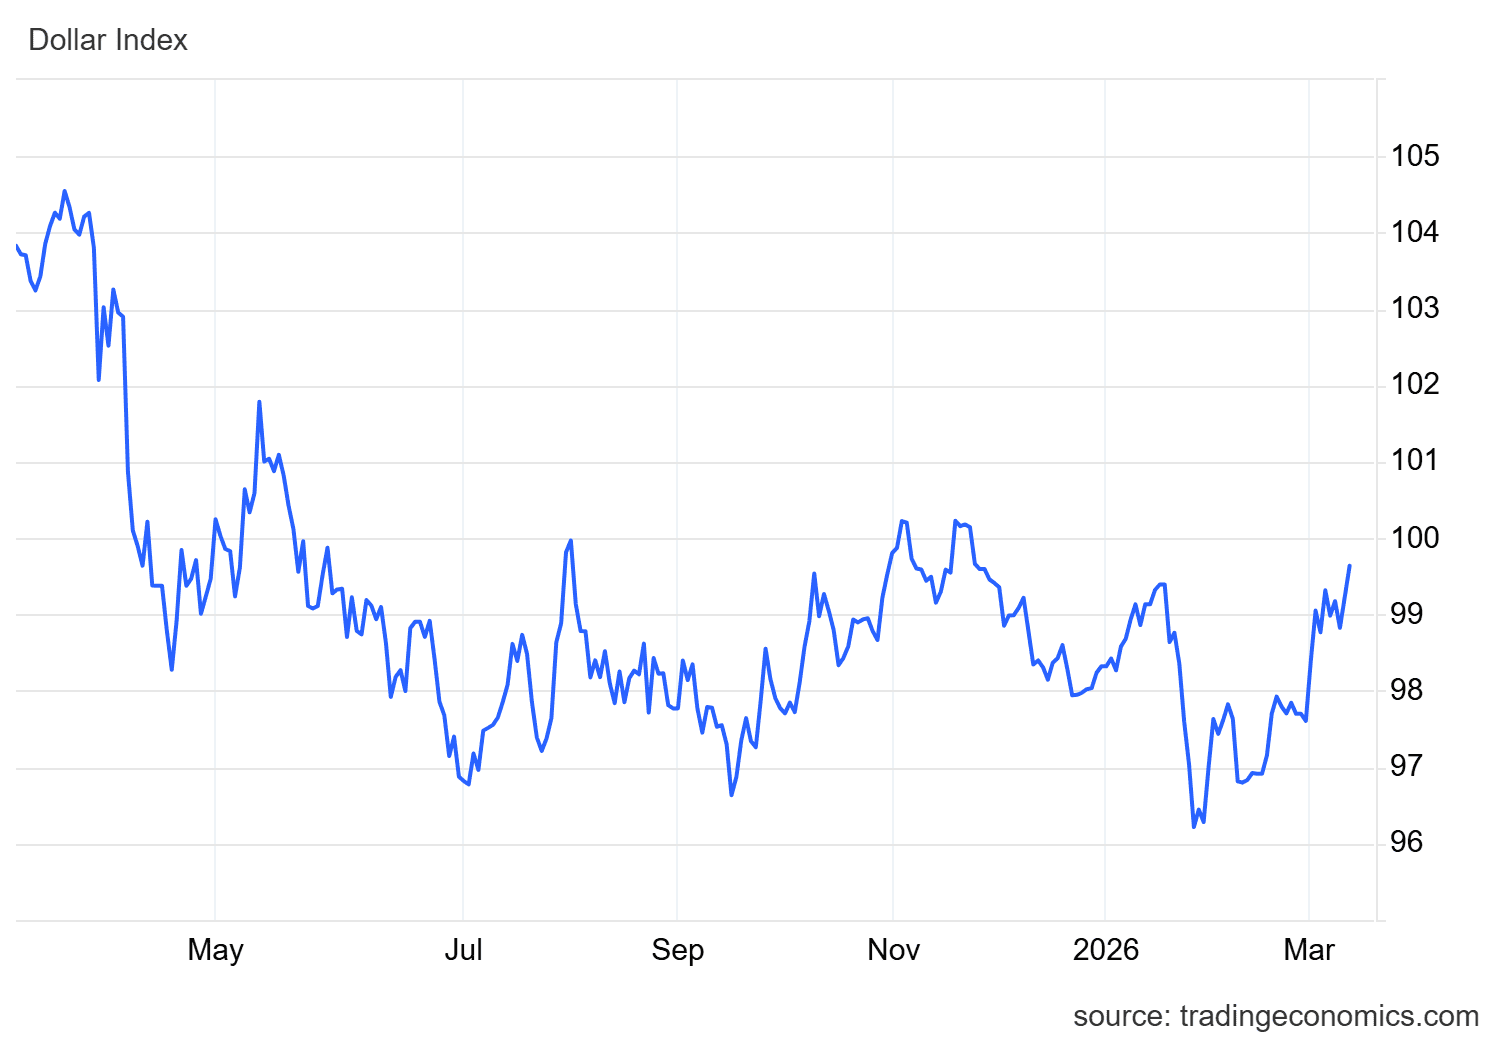
In this environment, the US dollar has once again consolidated its role as a short-term liquidity safe haven. Ongoing conflict updates have pushed the DXY index, which measures the dollar’s strength against its main peers, above the 99.5 level, moving closer to the key psychological 100 mark. The upward slope that began with the initial escalation remains intact, highlighting growing short-term demand for US dollars.
Source: TradingEconomics
Given this backdrop, as long as the conflict escalation continues to elevate risk perception and demand for safe-haven currencies such as the US dollar, the Canadian dollar may continue to lose ground. Without a short-term resolution, this dynamic could sustain more meaningful buying pressure in USD/CAD in the coming sessions.
Do Central Banks Matter?
Inflation data have already been released in the United States this week, and next week markets await monetary policy decisions from both the Bank of Canada and the Federal Reserve, which will define the potential policy direction for 2026.
In Canada, the benchmark rate currently stands at 2.25%, and no meaningful changes are expected at the next meeting, as the central bank has reiterated its intention to proceed cautiously in the short term.
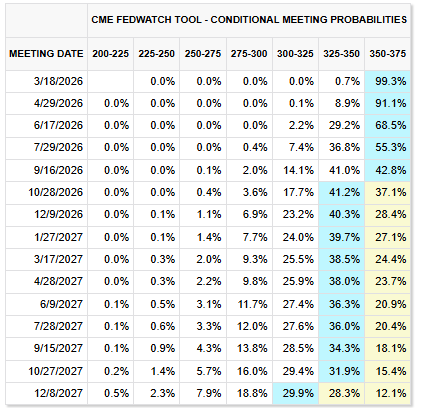
However, the greater surprise in recent weeks has come from the Federal Reserve. Until recently, markets expected rate cuts to begin from the current 3.75% level at the June meeting. However, with rising tensions and the possibility of persistent inflationary pressures, rate probability expectations have shifted significantly.
Currently, there is more than a 90% probability that rates will remain unchanged in March and April, while the probability of maintaining this same stance through July exceeds 50%. Additionally, there is a 42.8% probability that rates will remain unchanged in September, suggesting that potential rate cuts could be postponed until October 2026. This has temporarily removed expectations of lower interest rates in the US economy in the coming months.
Source: TradingEconomics
This shift is highly relevant, as markets previously anticipated rate reductions but now face a prolonged neutral-rate scenario. Given that US interest rates are significantly higher than those in Canada, this may continue to incentivize dollar-denominated investments over Canadian dollar assets.
As a result, consistent demand for the US dollar may consolidate, while the Canadian dollar temporarily loses appeal. This dynamic remains key for potential sustained buying pressure in USD/CAD in the coming sessions.
Technical Outlook for USD/CAD
Source: StoneX, Tradingview
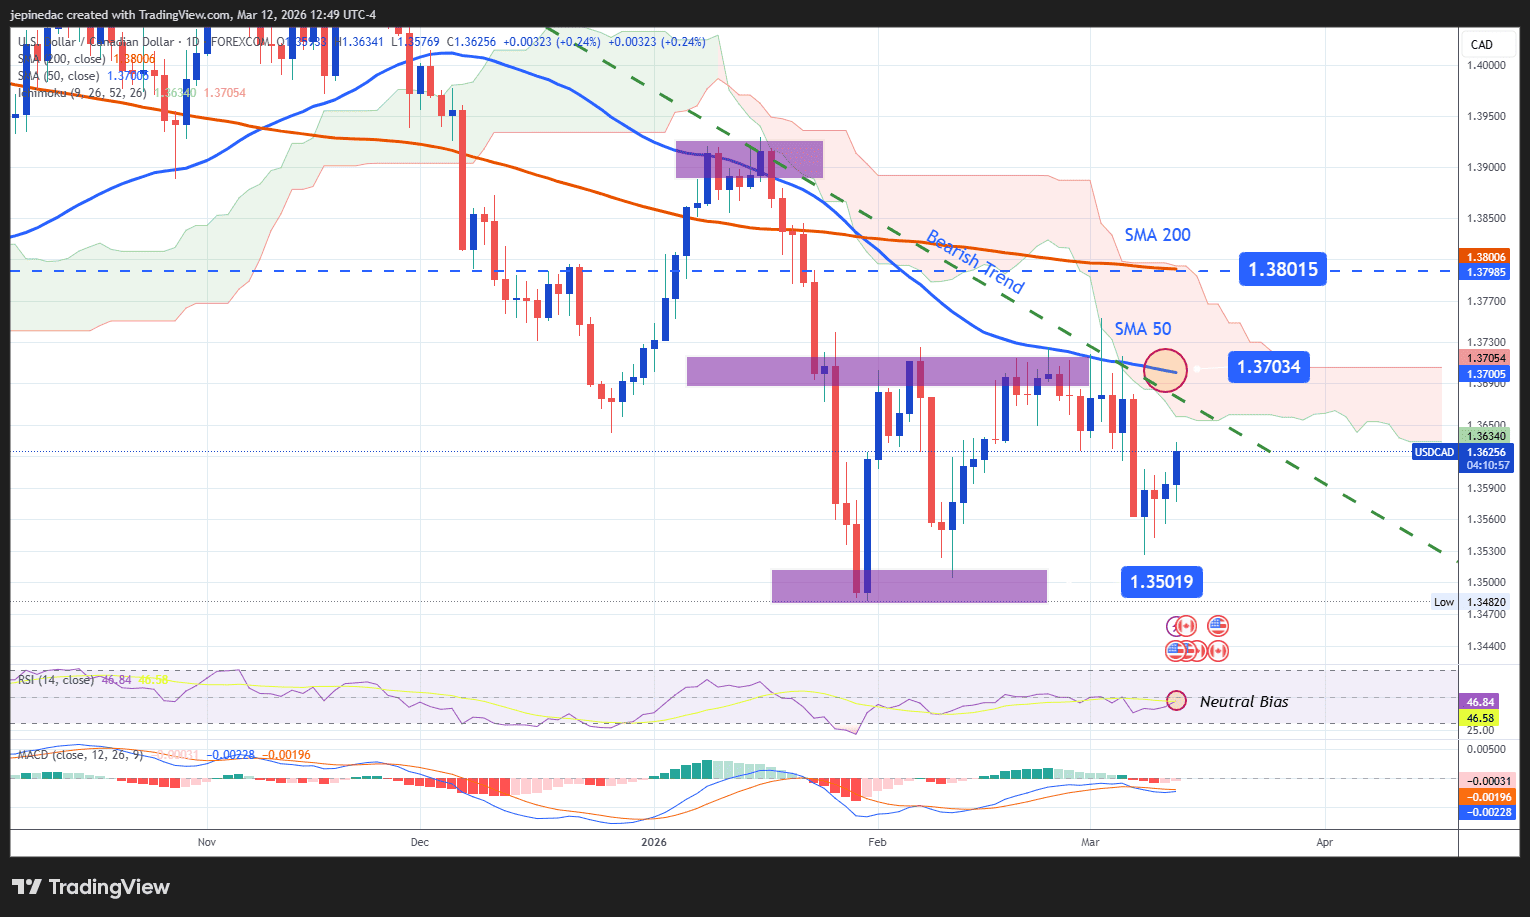
- Long-Term Trendline Enters Risk Zone: Since late November 2025, USD/CAD has maintained consistent bearish price action that formed a descending trendline on the daily chart. Over recent months, this has been the most relevant technical structure to monitor. However, with growing bullish momentum, prices have increasingly approached the descending trendline zone. If buying pressure remains consistent, a potential breakout above this line could give way to a more relevant bullish bias in the coming sessions.
- RSI: The RSI is currently hovering near the neutral 50 level, indicating balanced momentum over the last 14 sessions. If this behavior persists, a more pronounced phase of indecision could consolidate in the chart’s short-term price action.
- MACD: A similar scenario is observed in the MACD, with the histogram remaining close to the zero line, reflecting neutral short-term moving average momentum. If this dynamic continues, it could reinforce a more consistent indecisive environment in the coming sessions.
Key Levels:
- 1.38015 – Key Resistance: Level aligned with the 200-period moving average. Sustained moves above this zone could confirm a stronger structural shift and open the door to a new bullish trend in the coming weeks.
- 1.37034 – Critical Barrier: Area where the descending trendline converges with the 50-period simple moving average. A breakout above this level could invalidate the previous bearish structure and consolidate a dominant bullish bias.
- 1.35019 – Crucial Support: Level corresponding to a recent neutrality zone and the main downside barrier to monitor. Moves below this area could reactivate the bearish bias and restore the previous downtrend.
Written by Julian Pineda, CFA, CMT – Market Analyst
Follow him on: @julianpineda25






