
Expectations of a cautious FOMC outlook are building as crude extends weekly gains above 8%, dollar pairs hold a bullish rebound, and US indices stall ahead of tonight’s meeting.
Market Sentiment: Risk-On, But Cautious
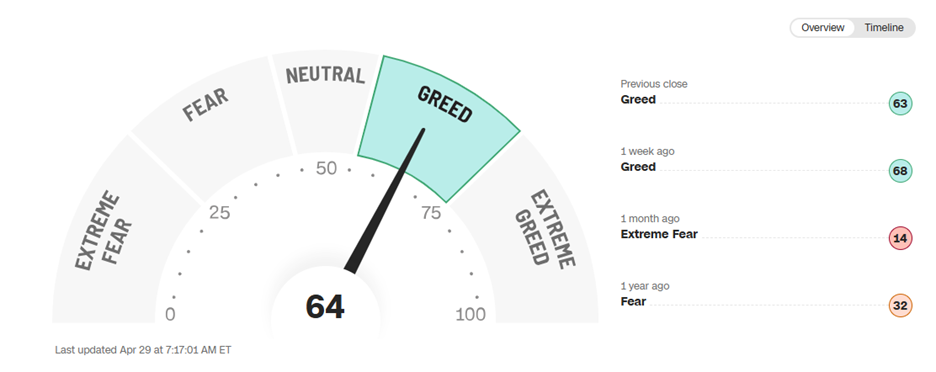
Fear and Greed Indicator
Source: CNN
Market sentiment remains in a broader risk-on mode, shifting into a more cautious stance ahead of the FOMC outlook and mega-cap earnings. Optimism around earnings and a potential easing in US–Iran tensions continues to support sentiment.
However, inflation risks driven by the Strait of Hormuz are becoming a competing force. While earnings and AI monetization remain key drivers, rising energy prices are adding pressure to the FOMC outlook, with WTI holding weekly gains above 8%, the DXY maintaining a bullish rebound near 99, and US bond yields rising over 1.8% on the week.
A hawkish tilt from the Fed—potentially reinforced by shifting expectations around future Fed leadership and inflation expectations—could significantly impact price action, keeping key levels and technical setups in focus as markets navigate elevated uncertainty and volatility.
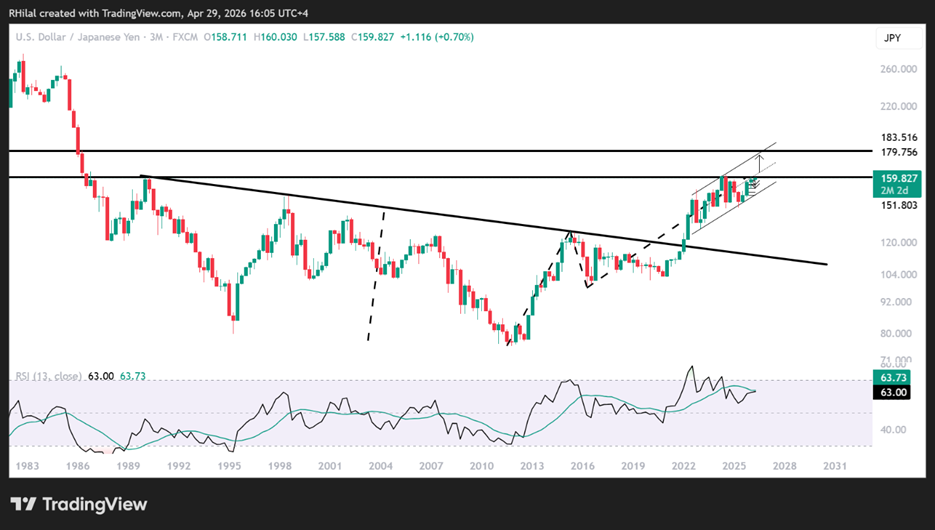
USDJPY Price Outlook: 3 Month Time Frame – Log Scale
Source: Trading view
Latest video analyzing the USDJPY pair: USD/JPY Holds 160, But for How Long?
From a broader perspective, USDJPY remains in a bullish primary trend, with price action trading within a parallel uptrend since 2022, supported by the long-term trendline connecting highs between 1990 and 2022.
Price is currently testing the 160 resistance level, which dates back to the 1990 highs and aligns with the 1.272 Fibonacci extension of the long-term trend spanning the 2011 lows, 2015 highs, and 2016 correction.
A confirmed break above 160—and then 164—could open the path toward 180, aligning with the 1978 lows and the upper bound of the 2022–2026 channel. This scenario would likely be supported by a more hawkish Fed outcome.
On the downside, price is also facing resistance near the midpoint of the channel. A break below 157.30 would increase short-term downside risks toward 154.80. A deeper move could extend toward the yearly lows near 152, aligning with the trendline connecting lower highs between 2024 and 2025.
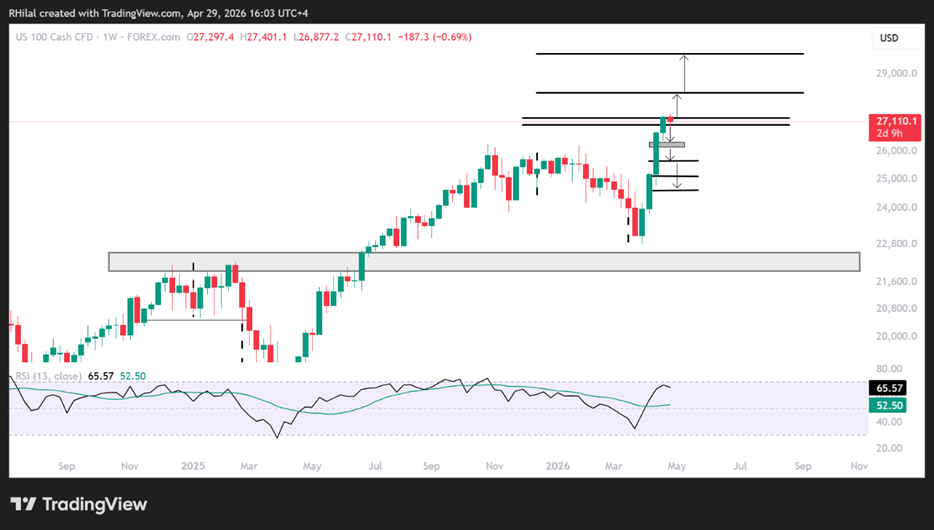
Nasdaq Price Outlook: Weekly Time Frame – Log Scale
Source: Trading view
From a weekly perspective, Nasdaq momentum is showing signs of slowing near overbought levels, similar to prior peaks seen in 2020 and 2025. This raises the risk of a pullback or momentum unwind as markets approach the FOMC decision, particularly with added pressure from Hormuz-related risks.
Key levels to watch, derived using Fibonacci extensions between the April 2025 lows, October 2025 highs, and April 2026 lows, are:
- 27,400 (0.5)
- 28,400 (0.618)
- 29,800 (0.786)
On the downside, a break below 26,900 would reinforce a pullback toward 26,300, 26,100, 25800 and 25,600.
Key Takeaway
Markets remain supported by earnings optimism and risk appetite, but rising energy-driven inflation risks are weighing on the FOMC outlook. This keeps volatility elevated and reinforces the importance of key technical levels across USDJPY and Nasdaq.
Written by Razan Hilal, CMT
Follow on X: @Rh_waves