
Key Events
- Gold volatility index surges to 2020 highs as prices push above the 5,600 mark, up 29% this month
- Crude oil also lifts above the 64 mark amid escalating U.S.–Iran war threats unless a nuclear deal materializes
- Thin liquidity conditions warrant caution, amplifying steep trends across commodities as global investor defensiveness increases
They say the trend is your friend, and gold’s steep volatility is exhausting contrarian short interest. Gold prices are up more than 29% this month, gaining roughly $1,250 since the start of 2026, while tracing sharp volatility swings on both the upside and downside, even as the primary uptrend remains intact. Dip-buying opportunities continue to emerge quickly, driven by fast execution flows, with volatility norms expanding toward $100 ranges.
Trump has publicly warned Iran that a “massive armada,” led by the USS Abraham Lincoln, is moving toward the Middle East, urging Tehran to accept a nuclear deal or face consequences he described as “far worse” than last year’s strikes.
Gold remains in a steep trend, reinforced by U.S. dollar weakness and U.S.–Iran geopolitical tensions. This combination elevates mean-reversion risks amid sensitive headlines, while keeping upside momentum alive toward the 6,000 threshold. Risk management remains critical in navigating these conditions, particularly as liquidity thins and global investors remain defensive.

Gold Outlook: 3-Month Time Frame – Log Scale


Source: Tradingview
Yes, the chart is scaled to a 3-month view to put the magnitude of the move into perspective. The first chart uses a line view to reduce noise and clarify the consolidation breakout, while the candlestick chart highlights the underlying price action and volatility.
Gold’s broader price action remained in consolidation for decades before breaking out sharply beyond its upper boundary in 2025, triggering an exponential advance. From a technical perspective, consolidation breakouts often project the height of the pattern in the direction of the breakout. In gold’s case, that implies steep upside potential, accompanied by heightened volatility risks in both directions.
Key upside thresholds come in near 6,000, 7,000, and potentially as high as 10,000 over extended scenarios. The dominant trend remains bullish, fueled by de-dollarization concerns and geopolitical frictions under Trump’s agenda, with the latest U.S.–Iran escalation reinforcing momentum near recent highs.
With gold currently trading near the 5,600 level, a sharp corrective phase could expose the 4,550 zone as a potential area where dip-buying interest may re-emerge. While that implies a 1,000-point retracement, it’s worth noting that prices were also roughly 1,000 points lower just two weeks ago.
Crude Oil Outlook
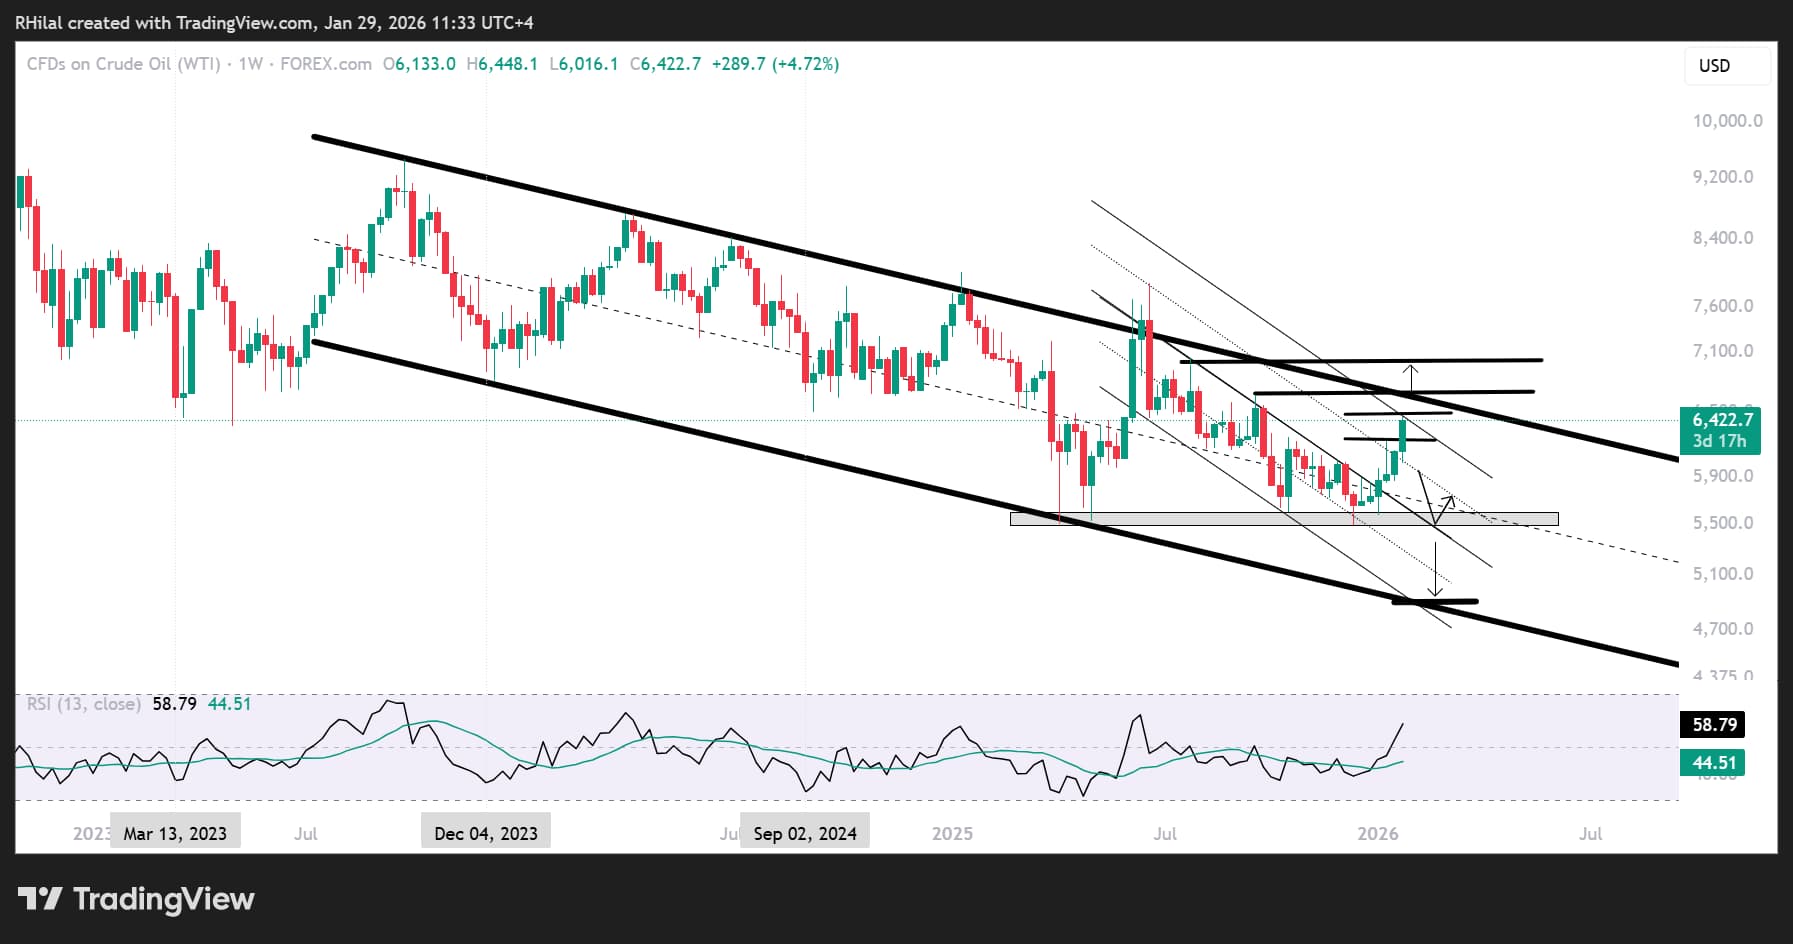
While gold dominates market attention, crude oil has also staged a notable rebound from its early-2026 lows, despite lingering oversupply concerns. The broader two-year trend for crude remains downward, with recent rallies largely representing rotations toward the upper boundary of a well-defined descending channel in place since September 2023, unless a clear structural shift develops beyond key resistance levels.
Crude Oil Outlook: Weekly Time Frame – Log Scale
Source: Trading view
From the 2023 highs, crude remains confined within bearish boundaries, where price action lifts intermittently on supply risks and geopolitical disruption headlines before realigning lower within the channel. The 2025 price base near the 55 mark closely resembles conditions seen so far in 2026, with prices now rebounding nearly $10 toward the 65 area.
Key Levels and Scenarios
- A sustained hold above 64.50 could extend gains toward the September 2025 high near 66.60, aligning with the upper boundary of the descending channel that has capped price since September 2023
- A weekly close above this zone would begin shifting the bias toward the bullish side, opening the door to the 70 threshold and a potentially more durable trend reversal
- On the downside, failure at current levels, particularly given alignment with the upper boundary of a duplicated channel respected between June and December 2025, would bring support at 61.80, 60.80, and 58.50 into focus
- A deeper pullback could re-expose the 55 level, either as another dip-buying opportunity or as a gateway toward the lower channel boundary near the 49 mark
Overall directional bias remains tilted to the downside, with recent gains driven more by geopolitical headlines than structural change. A shift in the longer-term outlook would require sustained closes above the key resistance levels outlined above.
Written by Razan Hilal, CMT
Follow on X: @Rh_waves