








ASX 200, Dow Jones Technical Analysis: Resistance Levels in Focus
ASX 200 and Dow Jones test key resistance after strong rallies. Bearish signals are building, with pullbacks likely as momentum shows signs of exhaustion.
Share this:

I’ve admittedly sounded like a broken record this past week, repeatedly calling for a top on the ASX 200 — only to watch it climb higher. The only saving grace has been my caution: I’ve consistently noted that a break below key support levels would be needed to confirm a pullback.
Now, once again, I’m leaning into a bearish short-term bias — but with updated resistance levels and price structure to guide the setup.
View related analysis:
- Japanese Yen (JPY) Sentiment Could Be at an Extreme: COT Report
- USD/JPY, USD/CHF, EUR/USD Analysis: USD Reversal Grinds Away
- USD/JPY, GBP/JPY Technical Outlook: BOJ Inaction Weighs on Japanese Yen
- ASX 200 Falters at Resistance, Pullback Pending?
View related analysis:
- Japanese Yen (JPY) Sentiment Could Be at an Extreme: COT Report
- USD/JPY, USD/CHF, EUR/USD Analysis: USD Reversal Grinds Away
- USD/JPY, GBP/JPY Technical Outlook: BOJ Inaction Weighs on Japanese Yen
- ASX 200 Falters at Resistance, Pullback Pending?
ASX 200 (Australian 200 Index): Monthly, Daily Charts
The ASX 200’s 3.4% month-over-month gain in April understates the index’s actual strength — it surged an impressive 13.6% from its April low to high. A large bullish hammer candle formed by month-end, suggesting buyers remain firmly in control. While this points to the potential for further upside, I remain cautious about how sustainable this level of bullish momentum is. A short-term pullback or two appears increasingly likely, even if the broader uptrend remains intact.
A hanging man candle formed on Thursday, signalling near-term exhaustion. It carries extra weight in my view, given that it formed beneath the January low and the 8200 handle. A bearish divergence has also emerged on the RSI (2), and with the 200-day SMA sitting at 8201, a notable cluster of resistance levels hovers nearby for bears to consider fading into.
Dow Jones (DJI Futures) Technical Analysis: Key Levels and Market Outlook
Of the three major Wall Street indices, the ASX 200 tends to share the strongest positive correlation with the Dow Jones Industrial Average (DJI futures). That makes current Dow price action particularly relevant for Australian traders.
At present, the Dow Jones rally appears to be stalling at critical resistance levels — specifically near the March low, the March 31 swing low, and a longer-term descending trendline. This confluence of resistance suggests a potential exhaustion point for bullish momentum.
Adding weight to the bearish case:
- The Dow Jones has printed eight consecutive bullish daily candles, a streak not seen since May 2024
- The Daily RSI (2) reached overbought territory on Tuesday, flagging stretched short-term conditions
Given these technical signals, a pullback on the Dow Jones appears increasingly likely. Such a move could serve as a bearish catalyst for the ASX 200, further reinforcing the case for a short-term retracement across both indices.
Economic Events in Focus (AEST / GMT+10)
- 09:30 - Japanese Unemployment, jobs/applications rate
- 09:50 – Japanese foreigner bond and stock purchases, BOJ monetary base
- 11:30 – Australian producer prices q/q, retail sales q/q
- 19:00 – EU core CPI
- 22:30 – US nonfarm payrolls, unemployment
- 00:00 – US core durables
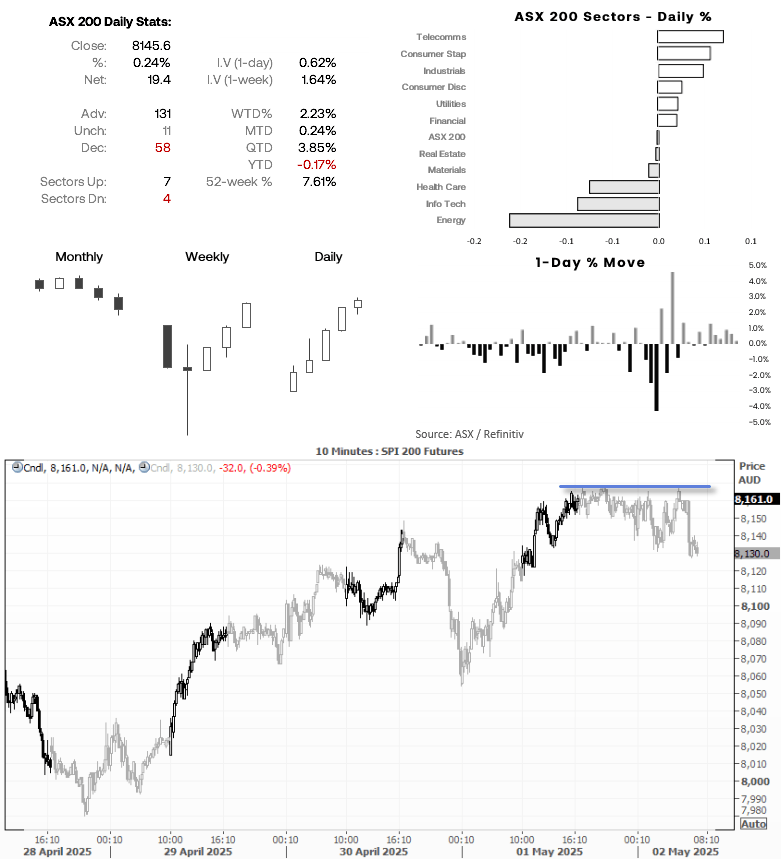
ASX 200 (Australian 200 Index) at a Glance
- The ASX 200 cash index rose for a sixth consecutive day (its best streak since September)
- 6 ASX sectors advanced, led by telecoms and consumer staples, 5 ASX sectors declined, led by energy and info tech
- The ASX 200 also on track for its third consecutive week high (its best streak in three months)
- ASX 200 futures (SPI 200) were -32 lower overnight (-0.39%) to suggest a gap lower at today’s open for the ASX cash index
-- Written by Matt Simpson
Follow Matt on Twitter @cLeverEdge
How to trade with City Index
You can trade with City Index by following these four easy steps:
- Open an account, or log in if you’re already a customer
• Open an account in the UK
• Open an account in Australia
• Open an account in Singapore
- Search for the market you want to trade in our award-winning platform
- Choose your position and size, and your stop and limit levels
- Place the trade


Open an account in minutes
Experience award-winning platforms with fast and secure execution, and enjoy tight spreads from 0.5 pts on FX and 0.3 pts on indices.
Economic calendar
Web Trader platform
Our sophisticated web-based platform is packed with features.
Related articles
Nikkei breakout accelerates as yen weakness returns
Nikkei has started October with a powerful breakout, helped by renewed yen weakness and strong upside momentum

Japanese Yen Outlook: USD/JPY, GBP/JPY, AUD/JPY Setups
USD/JPY and GBP/JPY show signs of stabilising, while AUD/JPY remains vulnerable as yen crosses deliver mixed technical signals.

S&P 500 Forecast: SPX Continues to Drift Away from Record Highs
Recent trading sessions have done little to restore confidence in the equity market. Over the last four sessions, the S&P 500 has declined by nearly 1.00%, a move that highlights growing short-term weakness and keeps the index moving further away from its record-high territory.

This report is intended for general circulation only. It should not be construed as a recommendation, or an offer (or solicitation of an offer) to buy or sell any financial products. The information provided does not take into account your specific investment objectives, financial situation or particular needs. Before you act on any recommendation that may be contained in this report, independent advice ought to be sought from a financial adviser regarding the suitability of the investment product, taking into account your specific investment objectives, financial situation or particular needs.
StoneX Financial Pte. Ltd., may distribute reports produced by its respective foreign entities or affiliates within the StoneX group of companies or third parties pursuant to an arrangement under Regulation 32C of the Financial Advisers Regulations. Where the report is distributed to a person in Singapore who is not an accredited investor, expert investor or an institutional investor (as defined in the Securities Futures Act), StoneX Financial Pte. Ltd. accepts legal responsibility to such persons for the contents of the report only to the extent required by law. Singapore recipients should contact StoneX Financial Pte. Ltd. at 6826 9988 for matters arising from, or in connection with the report.
In the case of all other recipients of this report, to the extent permitted by applicable laws and regulations neither StoneX Financial Pte. Ltd. nor its associated companies will be responsible or liable for any loss or damage incurred arising out of, or in connection with, any use of the information contained in this report and all such liability is hereby expressly disclaimed. No representation or warranty is made, express or implied, that the content of this report is complete or accurate.
StoneX Financial Pte. Ltd. is not under any obligation to update this report.
Trading CFDs carries a high level of risk that may not be suitable for some investors. Consider your investment objectives, level of experience, financial resources, risk appetite and other relevant circumstances carefully. The possibility exists that you could lose some or all of your investments, including your initial deposits. If in doubt, please seek independent expert advice. Visit www.forex.com/en-sg/terms-and-policies for the complete Risk Disclosure Statement.